What is a Big Play Worth?
Introduction
I was listening to a recent episode of Phantom Island where Steven Godfrey had a discussion with guest Parker Fleming about the idea behind explosive plays. I've been fiddling with college football team models for a few years but this is really the first season I've gotten deeper into it so until this point I've just been using either CFBD's own metric or Bill Connelly's version (average yards per successful play) to measure explosiveness. So based on their discussions I thought I'd try just validating their observations and conclusions based on the recent seasons I have data for (2015-2026, excluding 2020) and make that data available to others in a more easily digestible (or easily referenced) format.
What follows is a summary of my reimplementation of some of the metrics they discussed but doesn't cover everything they talked about. This is 1.77 million plays across 2015–2026, FBS against FBS, garbage time removed, 2020 excluded from every trend. About 186,000 drives.
TL;DR:
- 16 yards is where the bar separates scoring drives from failures best.
- 67.5% of drives with an explosive play end in points. Without one, only 12.4%.
- +3.3 points of final margin for each extra explosive play a team makes.
- 46% of the time, a drive never would have reached the yard line one explosive play just handed it.
- 56% of a scoring drive's advantage is field position the explosive plays bought outright.
1. What do we mean when we talk about explosiveness?
Before measuring anything, you have to define what you are measuring. Most arguments about explosive plays are really two people using different denominators without noticing.
Here's three examples I've seen used when people talk about explosiveness. They all do measure explosiveness, but they answer different questions:
- EPA per successful play. CFBD's definition. It asks: when you stay on schedule, how much is it worth? It has no yardage bar at all.
- Big-play rate. The share of all snaps that gain at least some threshold — often 20 yards, on the podcast Parker Fleming mentioned 10+ yards on a rush or 15+ yards on a drop back. It asks: how often does a chunk play happen?
- Yards per big play. The average gain on the plays that cleared the bar. It asks: when a chunk play happens, how big is it?
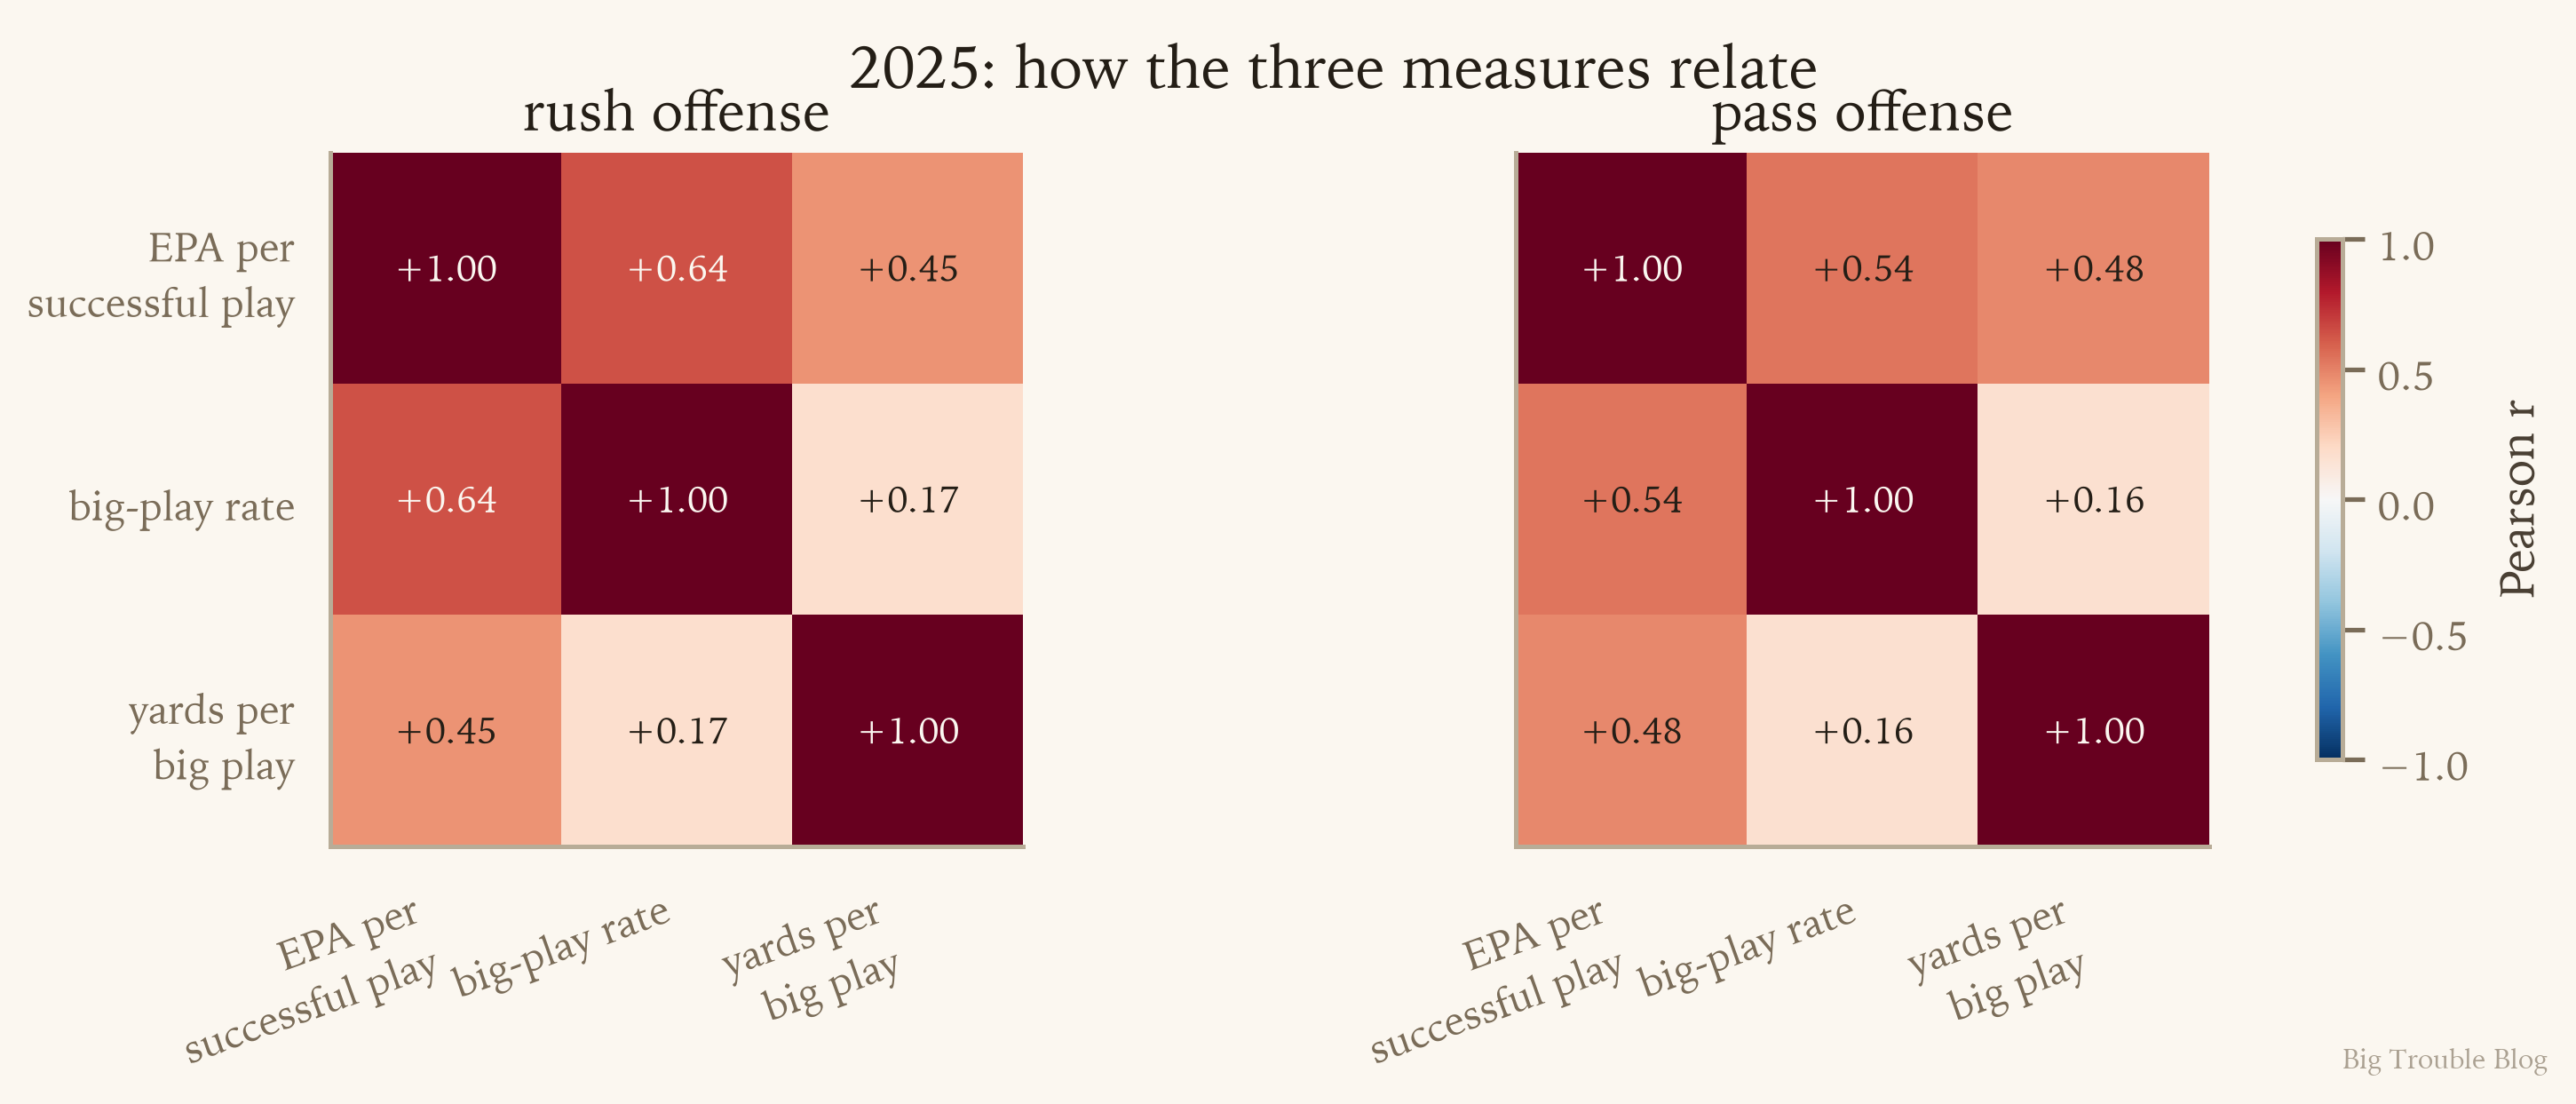
They are not substitutes. EPA per successful play and big-play rate correlate around 0.6, which sounds high until you notice that yards per big play is weakly correlated with the rate on pass offense (+0.16).
2. How should we define an explosive play?
As far as I could tell, twenty yards is a round number people use as a rule of thumb. Here is what happens when you test every bar from 2 to 60.
The idea is straightforward: set the bar too low and nearly every drive has an "explosive" play, so the label means nothing; set it too high and almost none are, so it means nothing again. Somewhere in between, the split should open and then close. Our metric for this test is variance explained, that is, how much of the spread in a drive scoring comes from having the label of explosive vs not having it.
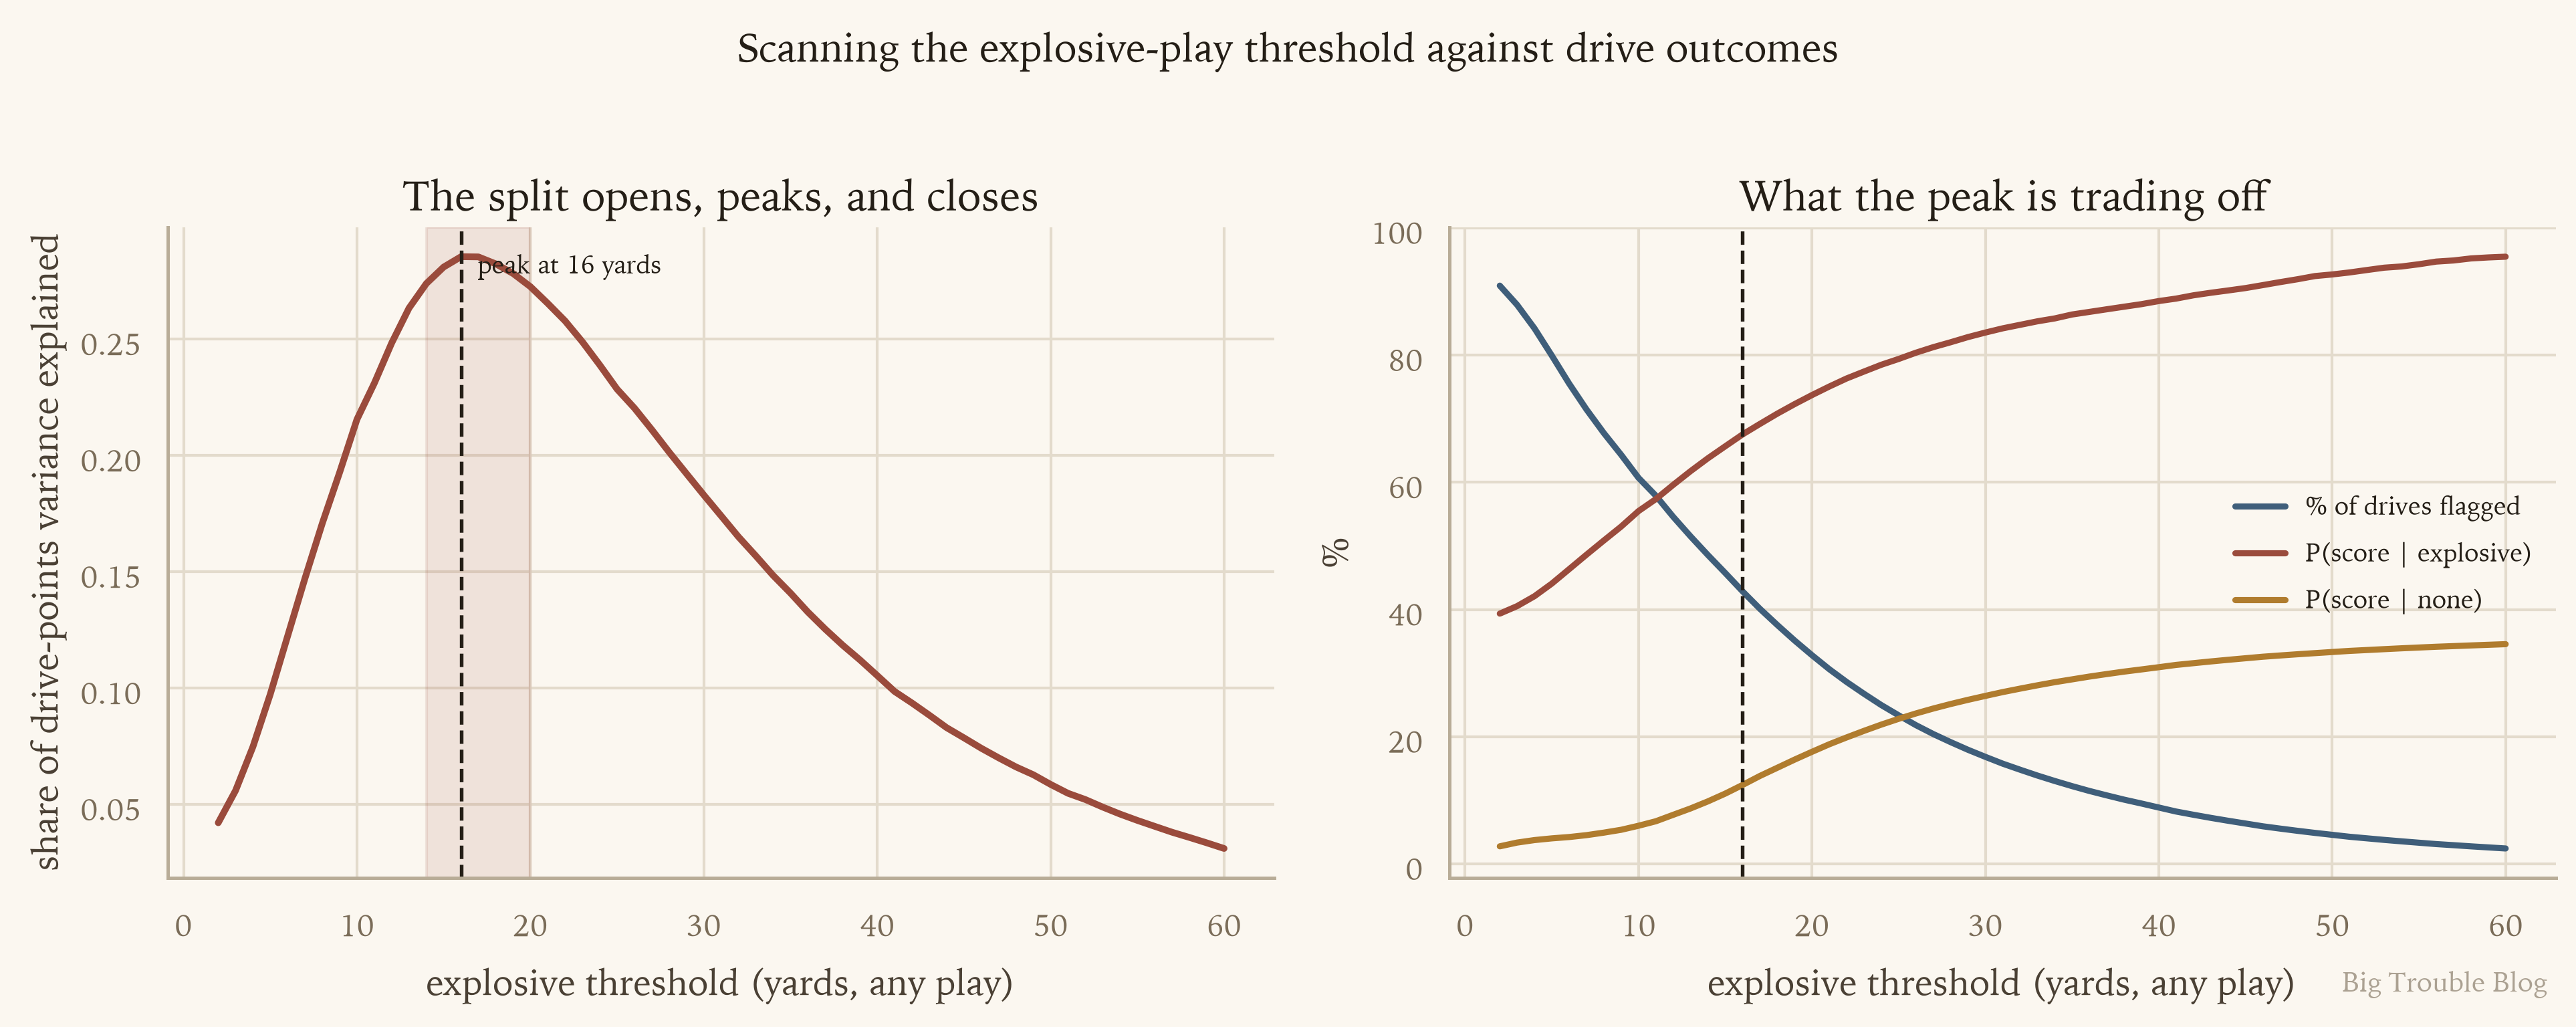
Left: The plot quickly peaks at 16 and then gradually falls. Right: At a 2-yard bar, 91% of drives are flagged. At 60 yards only 2.5% are.
Should runs and passes have different bars?
While some people just use a single yardage gain on any play as the measure of explosiveness, the one Fleming mentioned during the podcast was: 10+ yards on a rush or 15+ yards on a drop back. That is a significantly less stringent threshold so its worth testing as well.
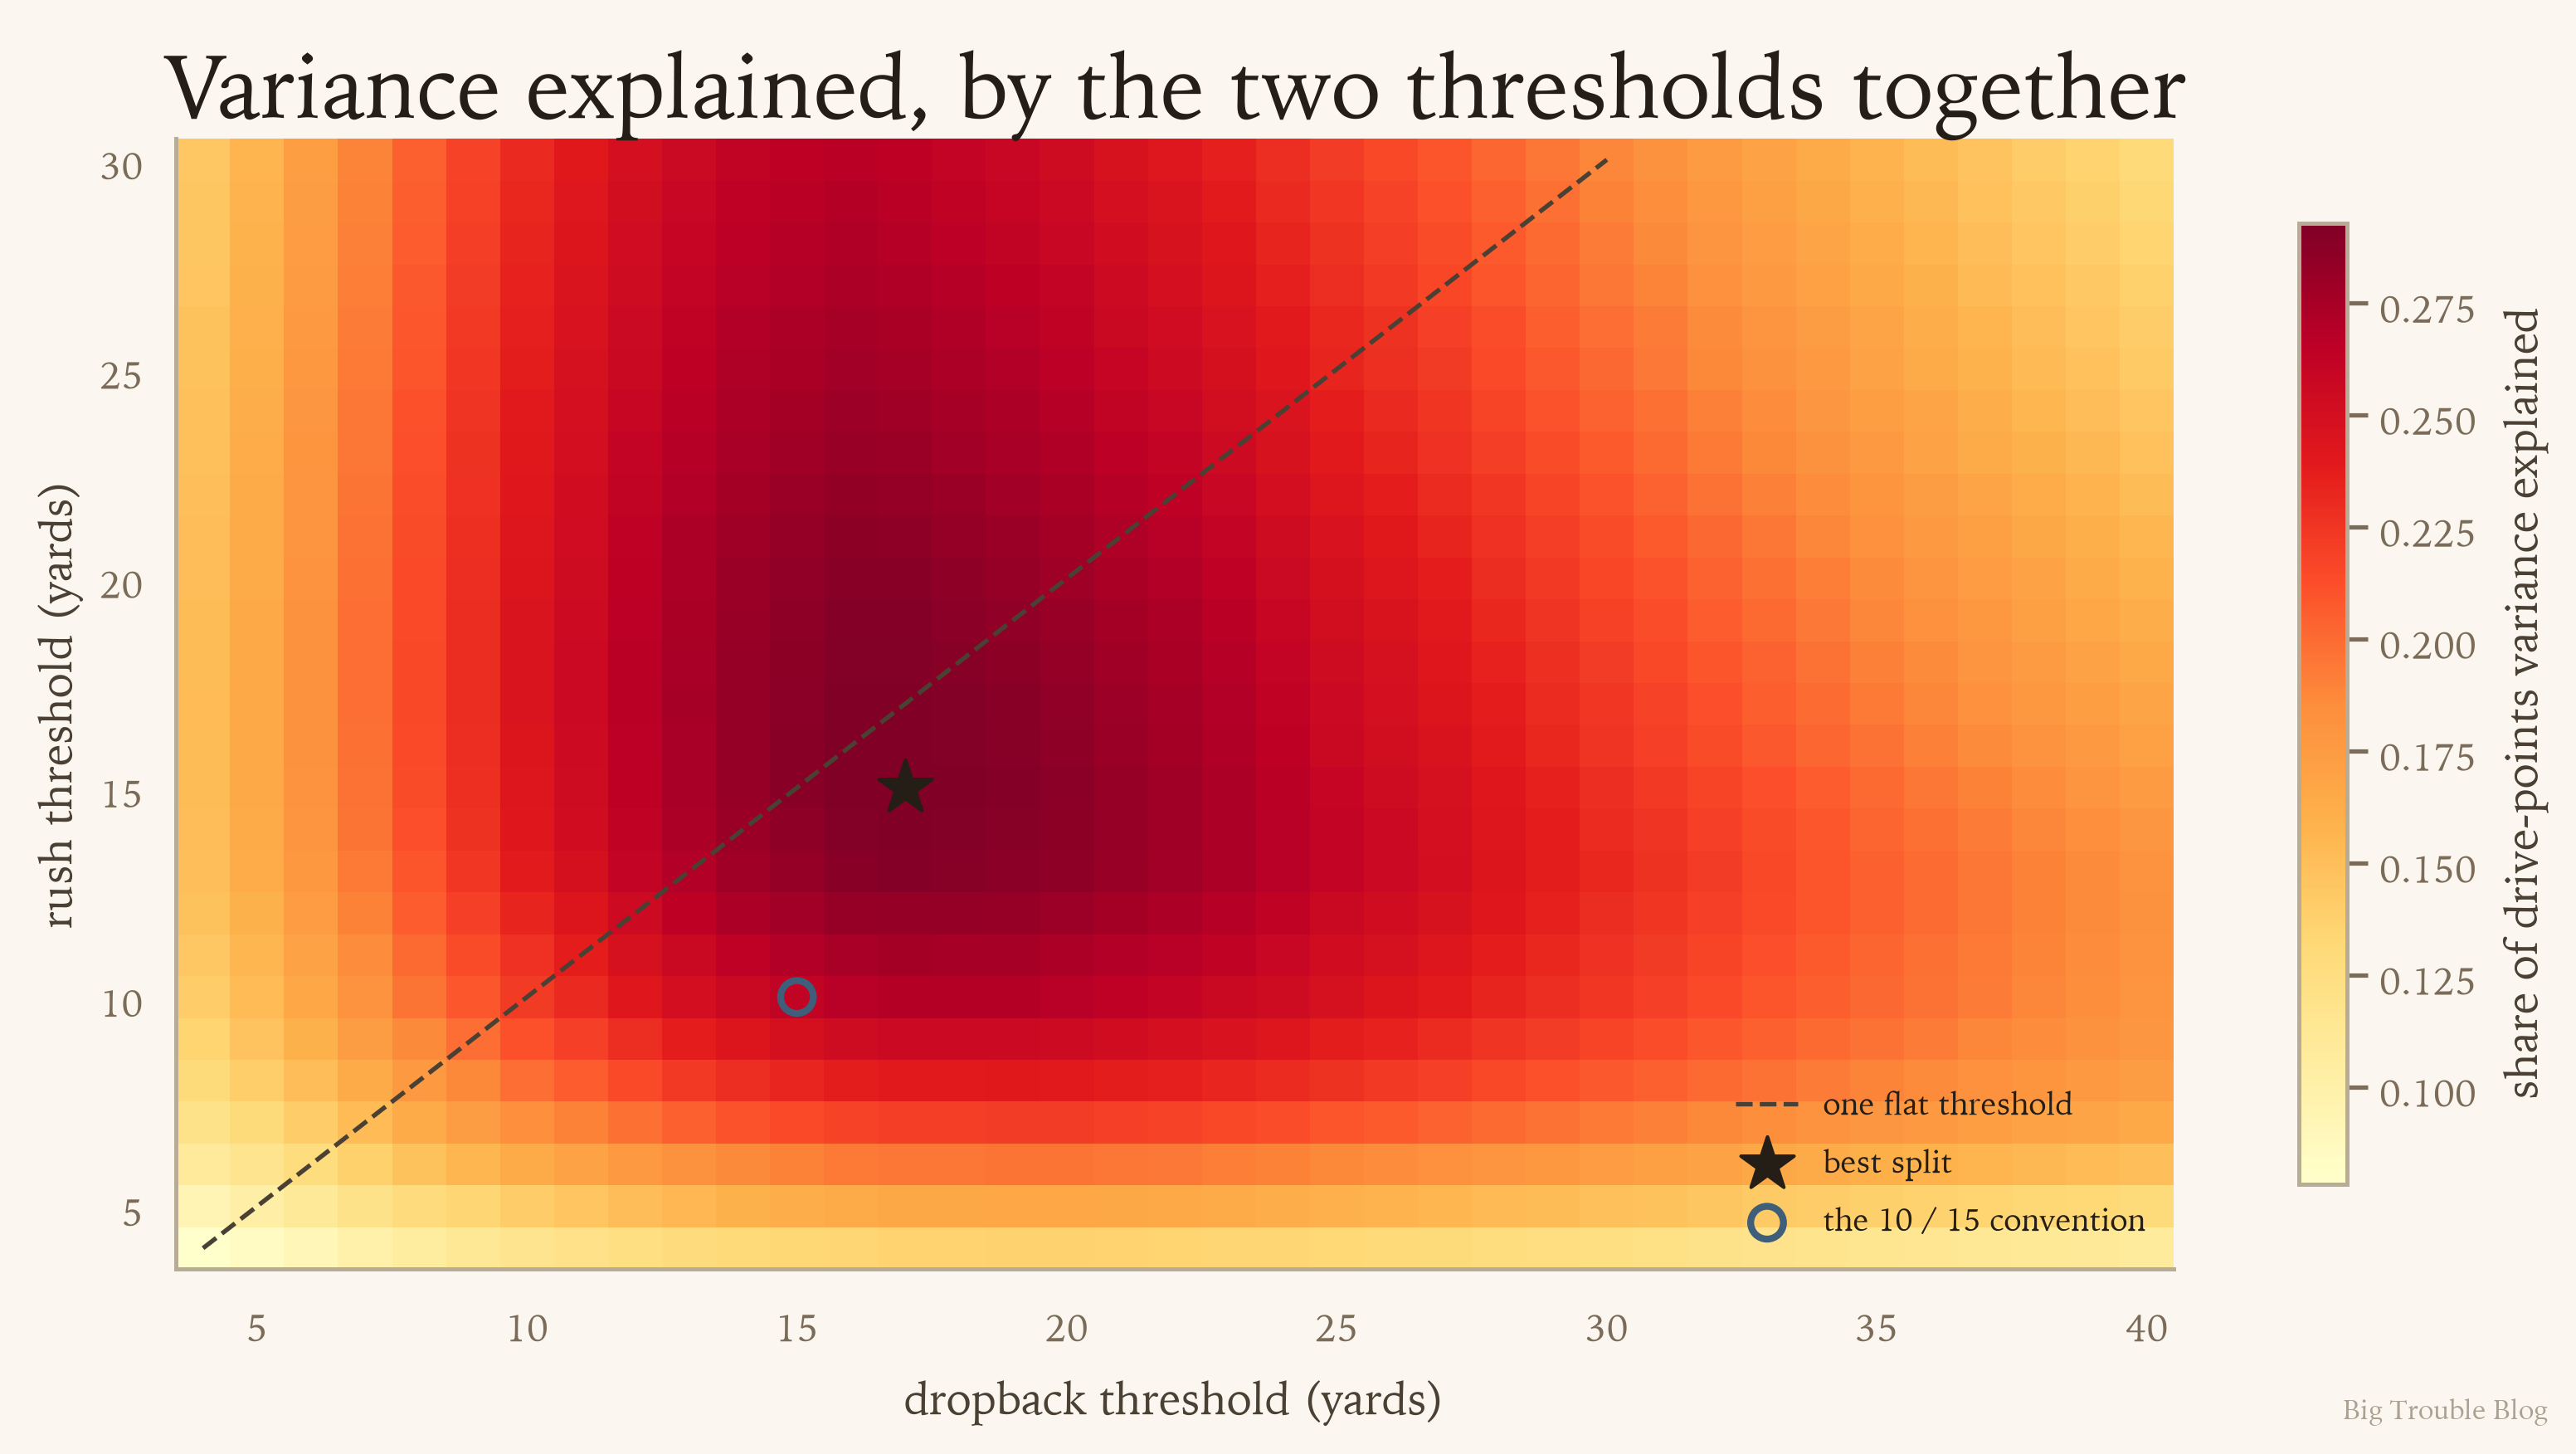
The peak straddles the diagonal. The best split pair (rush 15 / dropback 17) beats the best single flat number by 3.7%.
| Rule | variance explained |
|---|---|
| rush 10 / dropback 15 | 0.2625 |
| flat 20 on any play | 0.2689 |
| flat 16 on any play | 0.2824 |
| rush 15 / dropback 17 (best split) | 0.2927 |
A drive does not care how the yards arrived. A twenty yard gain is the same whether it came from a rush or a pass.
While the single best point explored had a very slight split in rush/pass threshold, its a small gain compared to the flat 16 yard threshold and just adds unnecessary complexity to the discussion. So for the rest of the post I'll be using 16+ yards for any offensive gain as the definition of an explosive play.
3. Can you score without one?
Mostly, no.
80.3% of scoring drives contain an explosive play, whereas only 21.8% of drives that didn't score have an explosive play.
| Drive | scores | no points | defense scores |
|---|---|---|---|
| with an explosive play | 67.5% | 31.6% | 0.9% |
| without one | 12.4% | 85.5% | 2.1% |
A drive without a single explosive play almost never scores. Nine in ten end with nothing. However, even on drives with an explosive play, you still fail to score around one third of the time.
An under-discussed aspect of this, a drive with no explosive play is 2.3× more likely to end in points for the opponent.
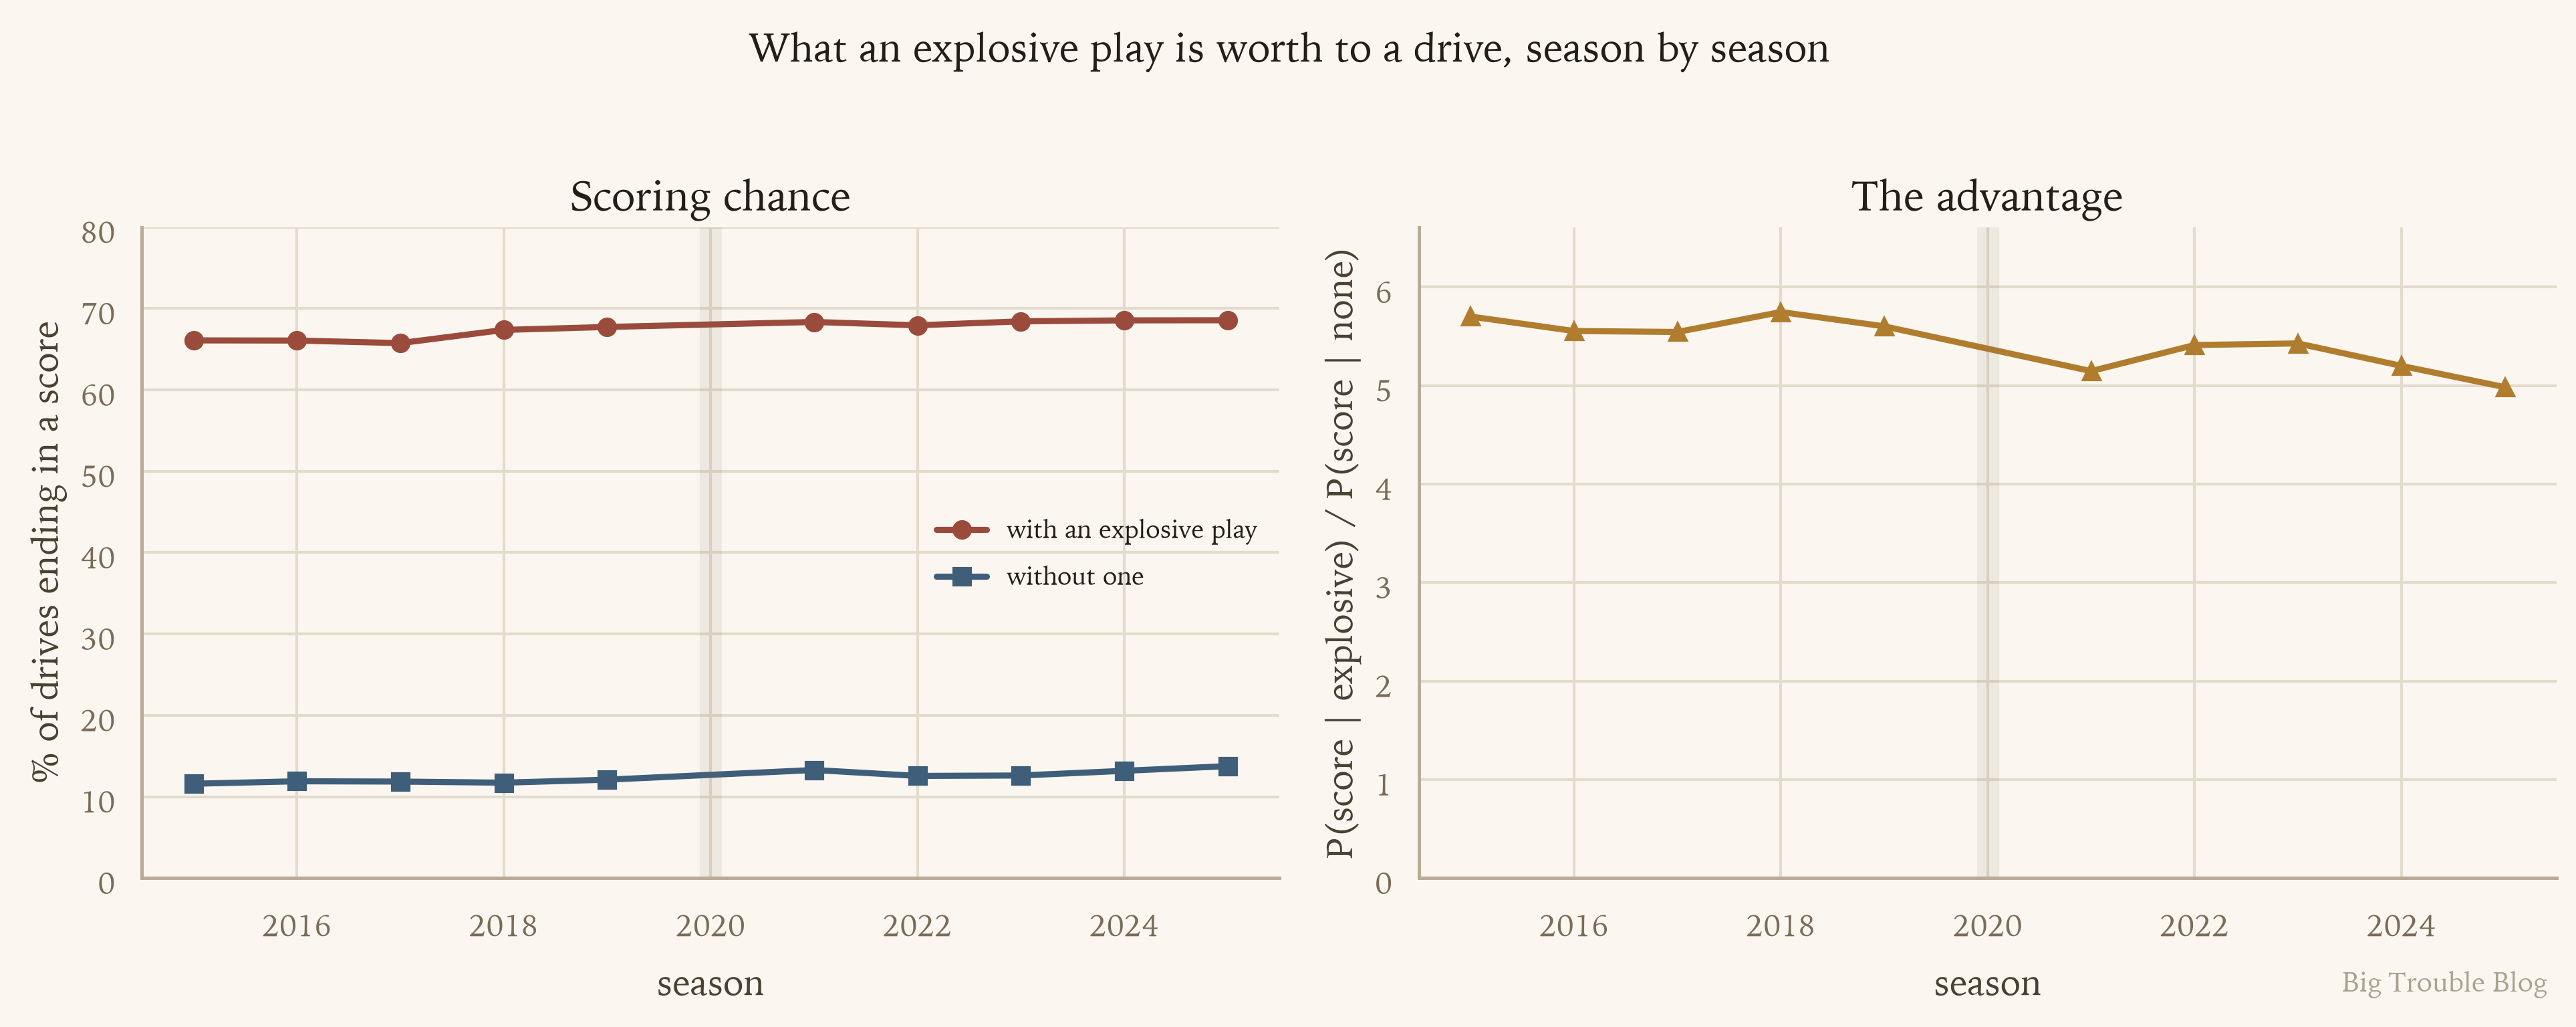
Drives with an explosive play score slightly more often than in 2015 (66.1% → 68.6%). But drives without one improved faster, 11.6% → 13.8% — a 19% relative gain.
4. Are there diminishing returns?
A drive with an explosive play is worth +3.93 net points. A drive without one is worth +0.48. The gap is +3.46 points, and it is very consistent season-to-season — between +3.38 and +3.54 in every season measured.
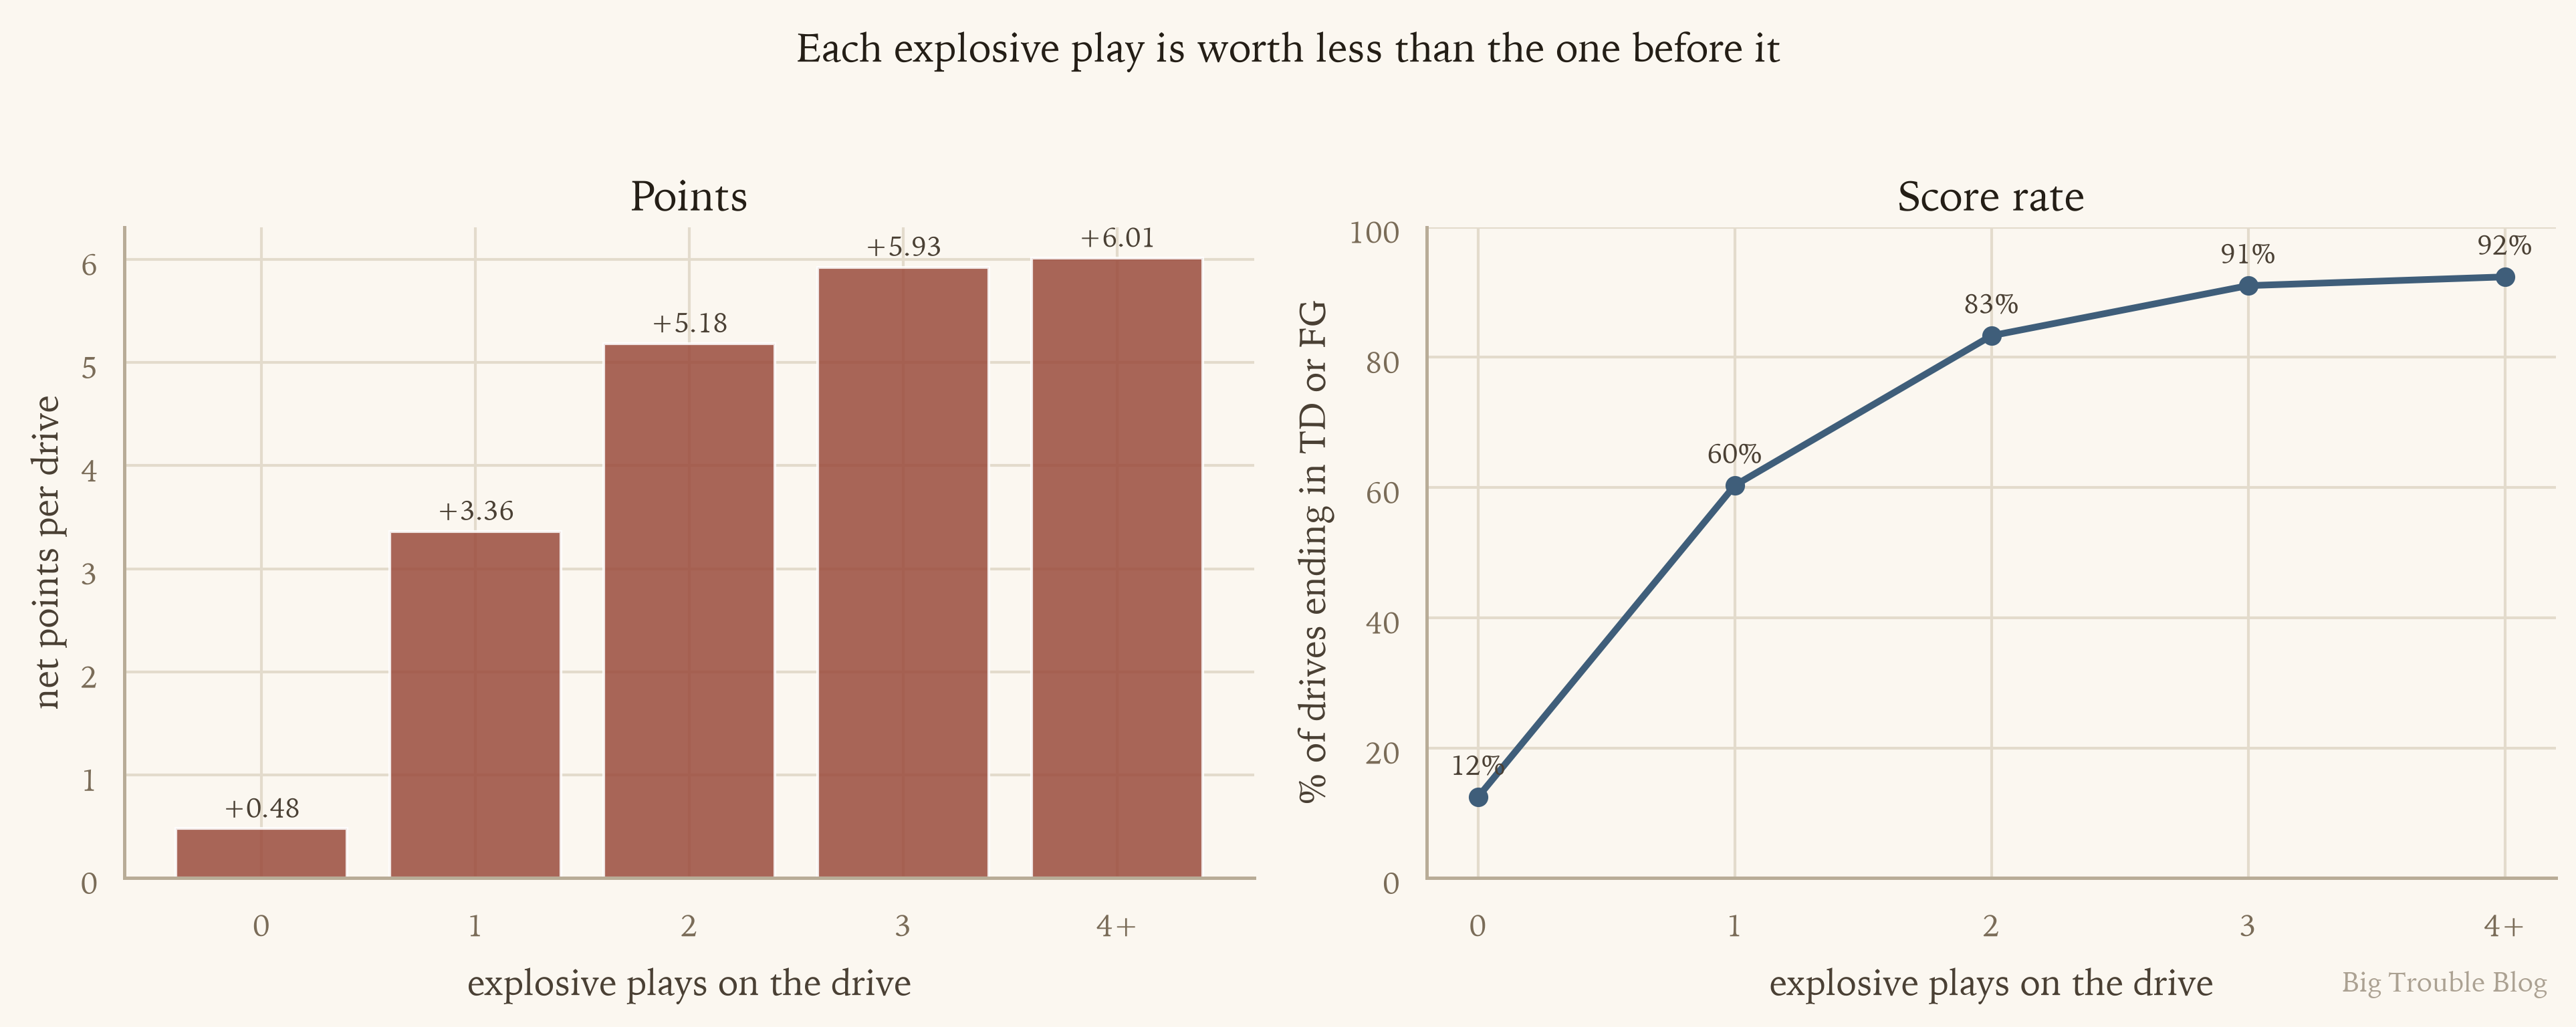
Sharply diminishing returns. The first explosive play is worth +2.89 points, the second +1.82, the third only +0.74, and a fourth +0.09. By the third the drive has already scored 91% of the time.
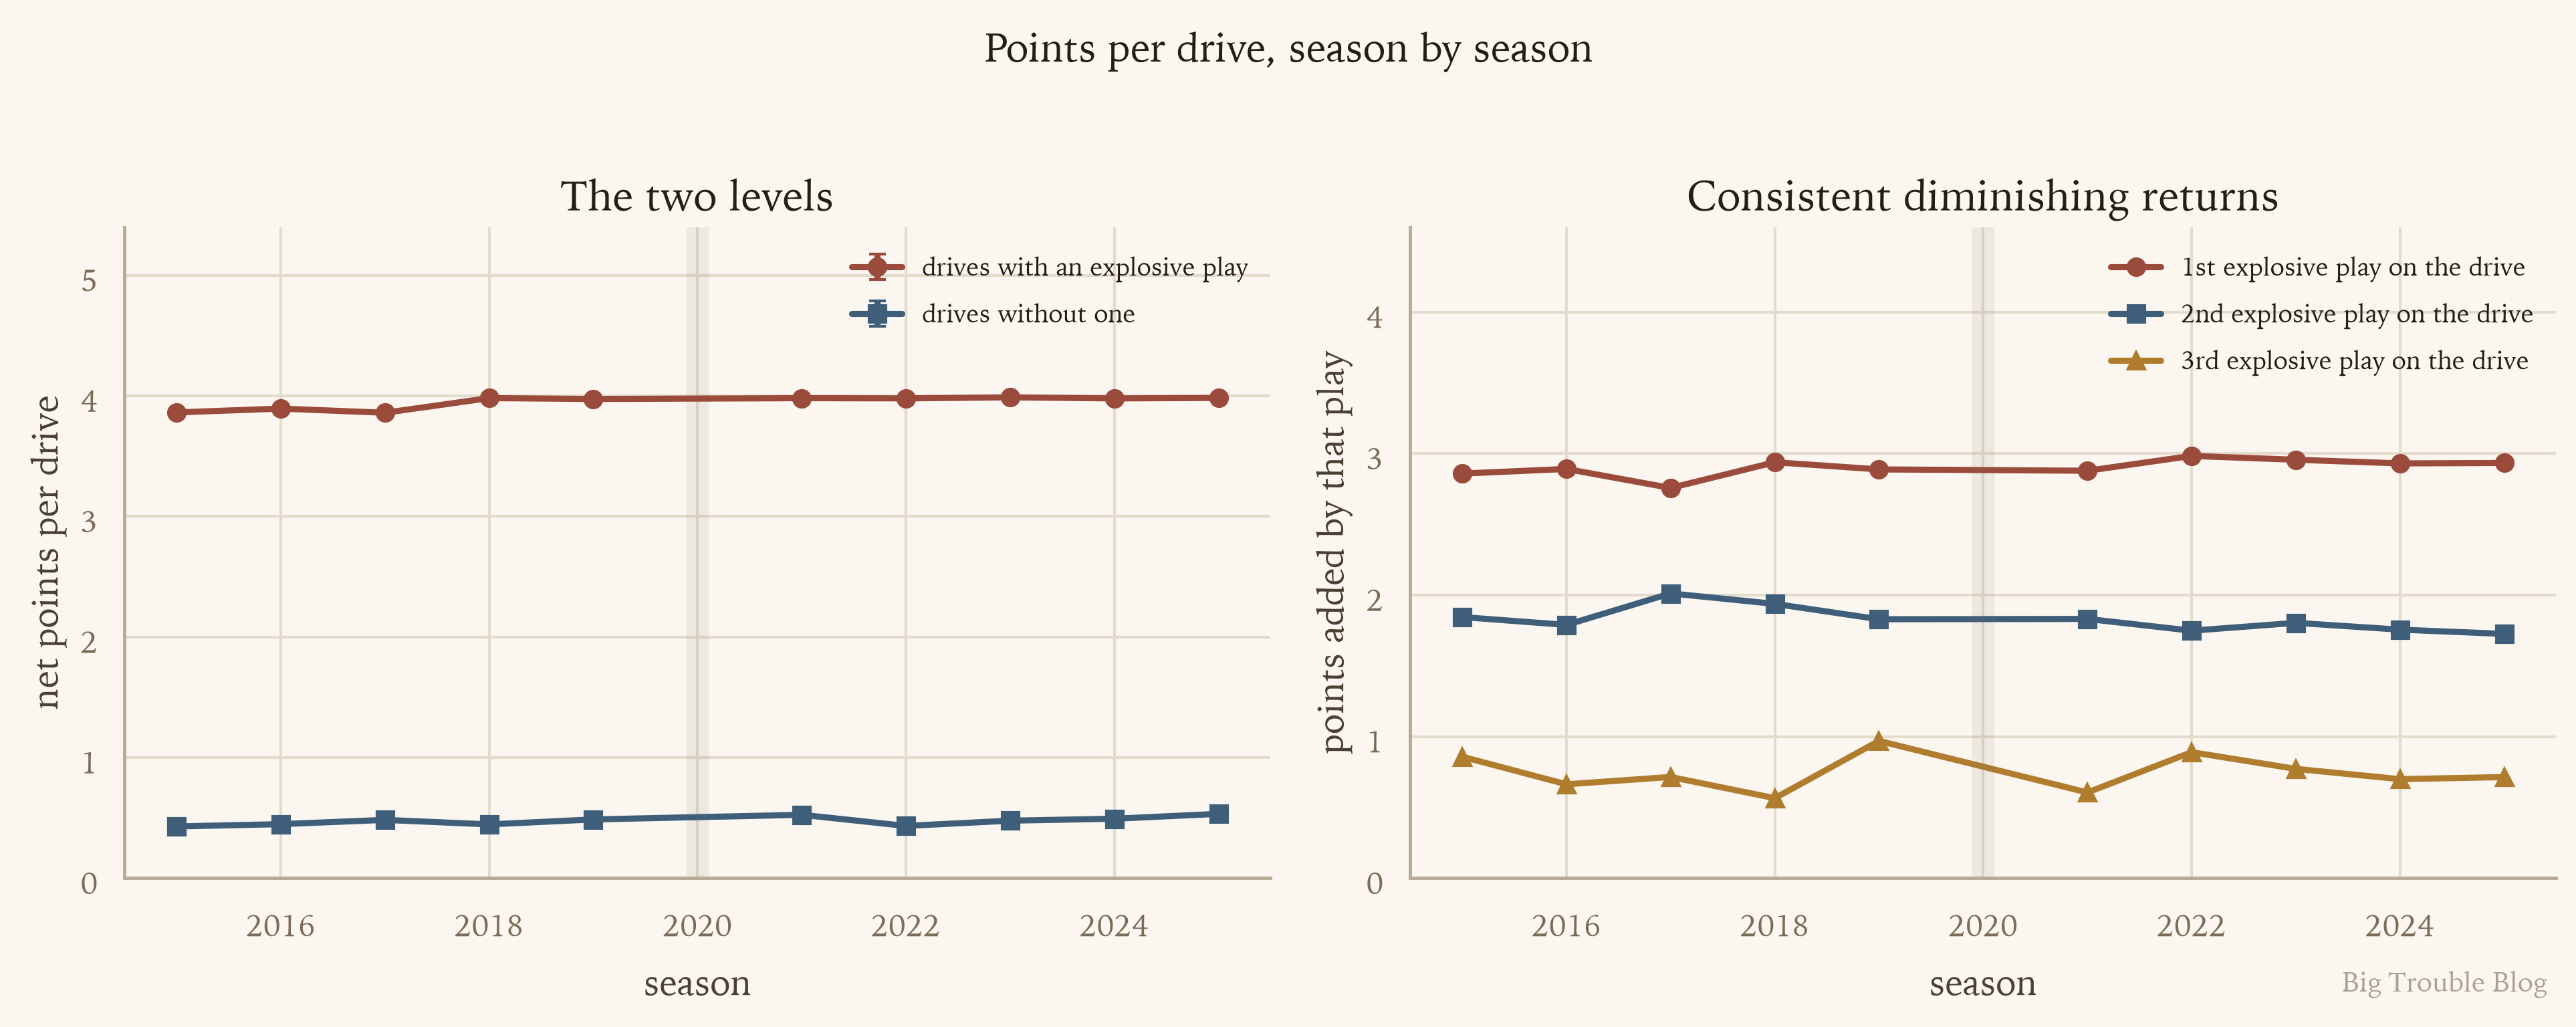
Effectively flat curves. The first explosive play on a drive has been worth between +2.76 and +2.96 points in every single season.
5. How much is an explosive play worth?
The previous question was drive based, so let's try another method to see if we can calculate the average value of a single explosive play.
Take every game, subtract one team's explosive-play count from the other's, and divide the point margin on that difference. The slope is +3.33 points per explosive play, and the relationship explains 35% of the variance in final margin.
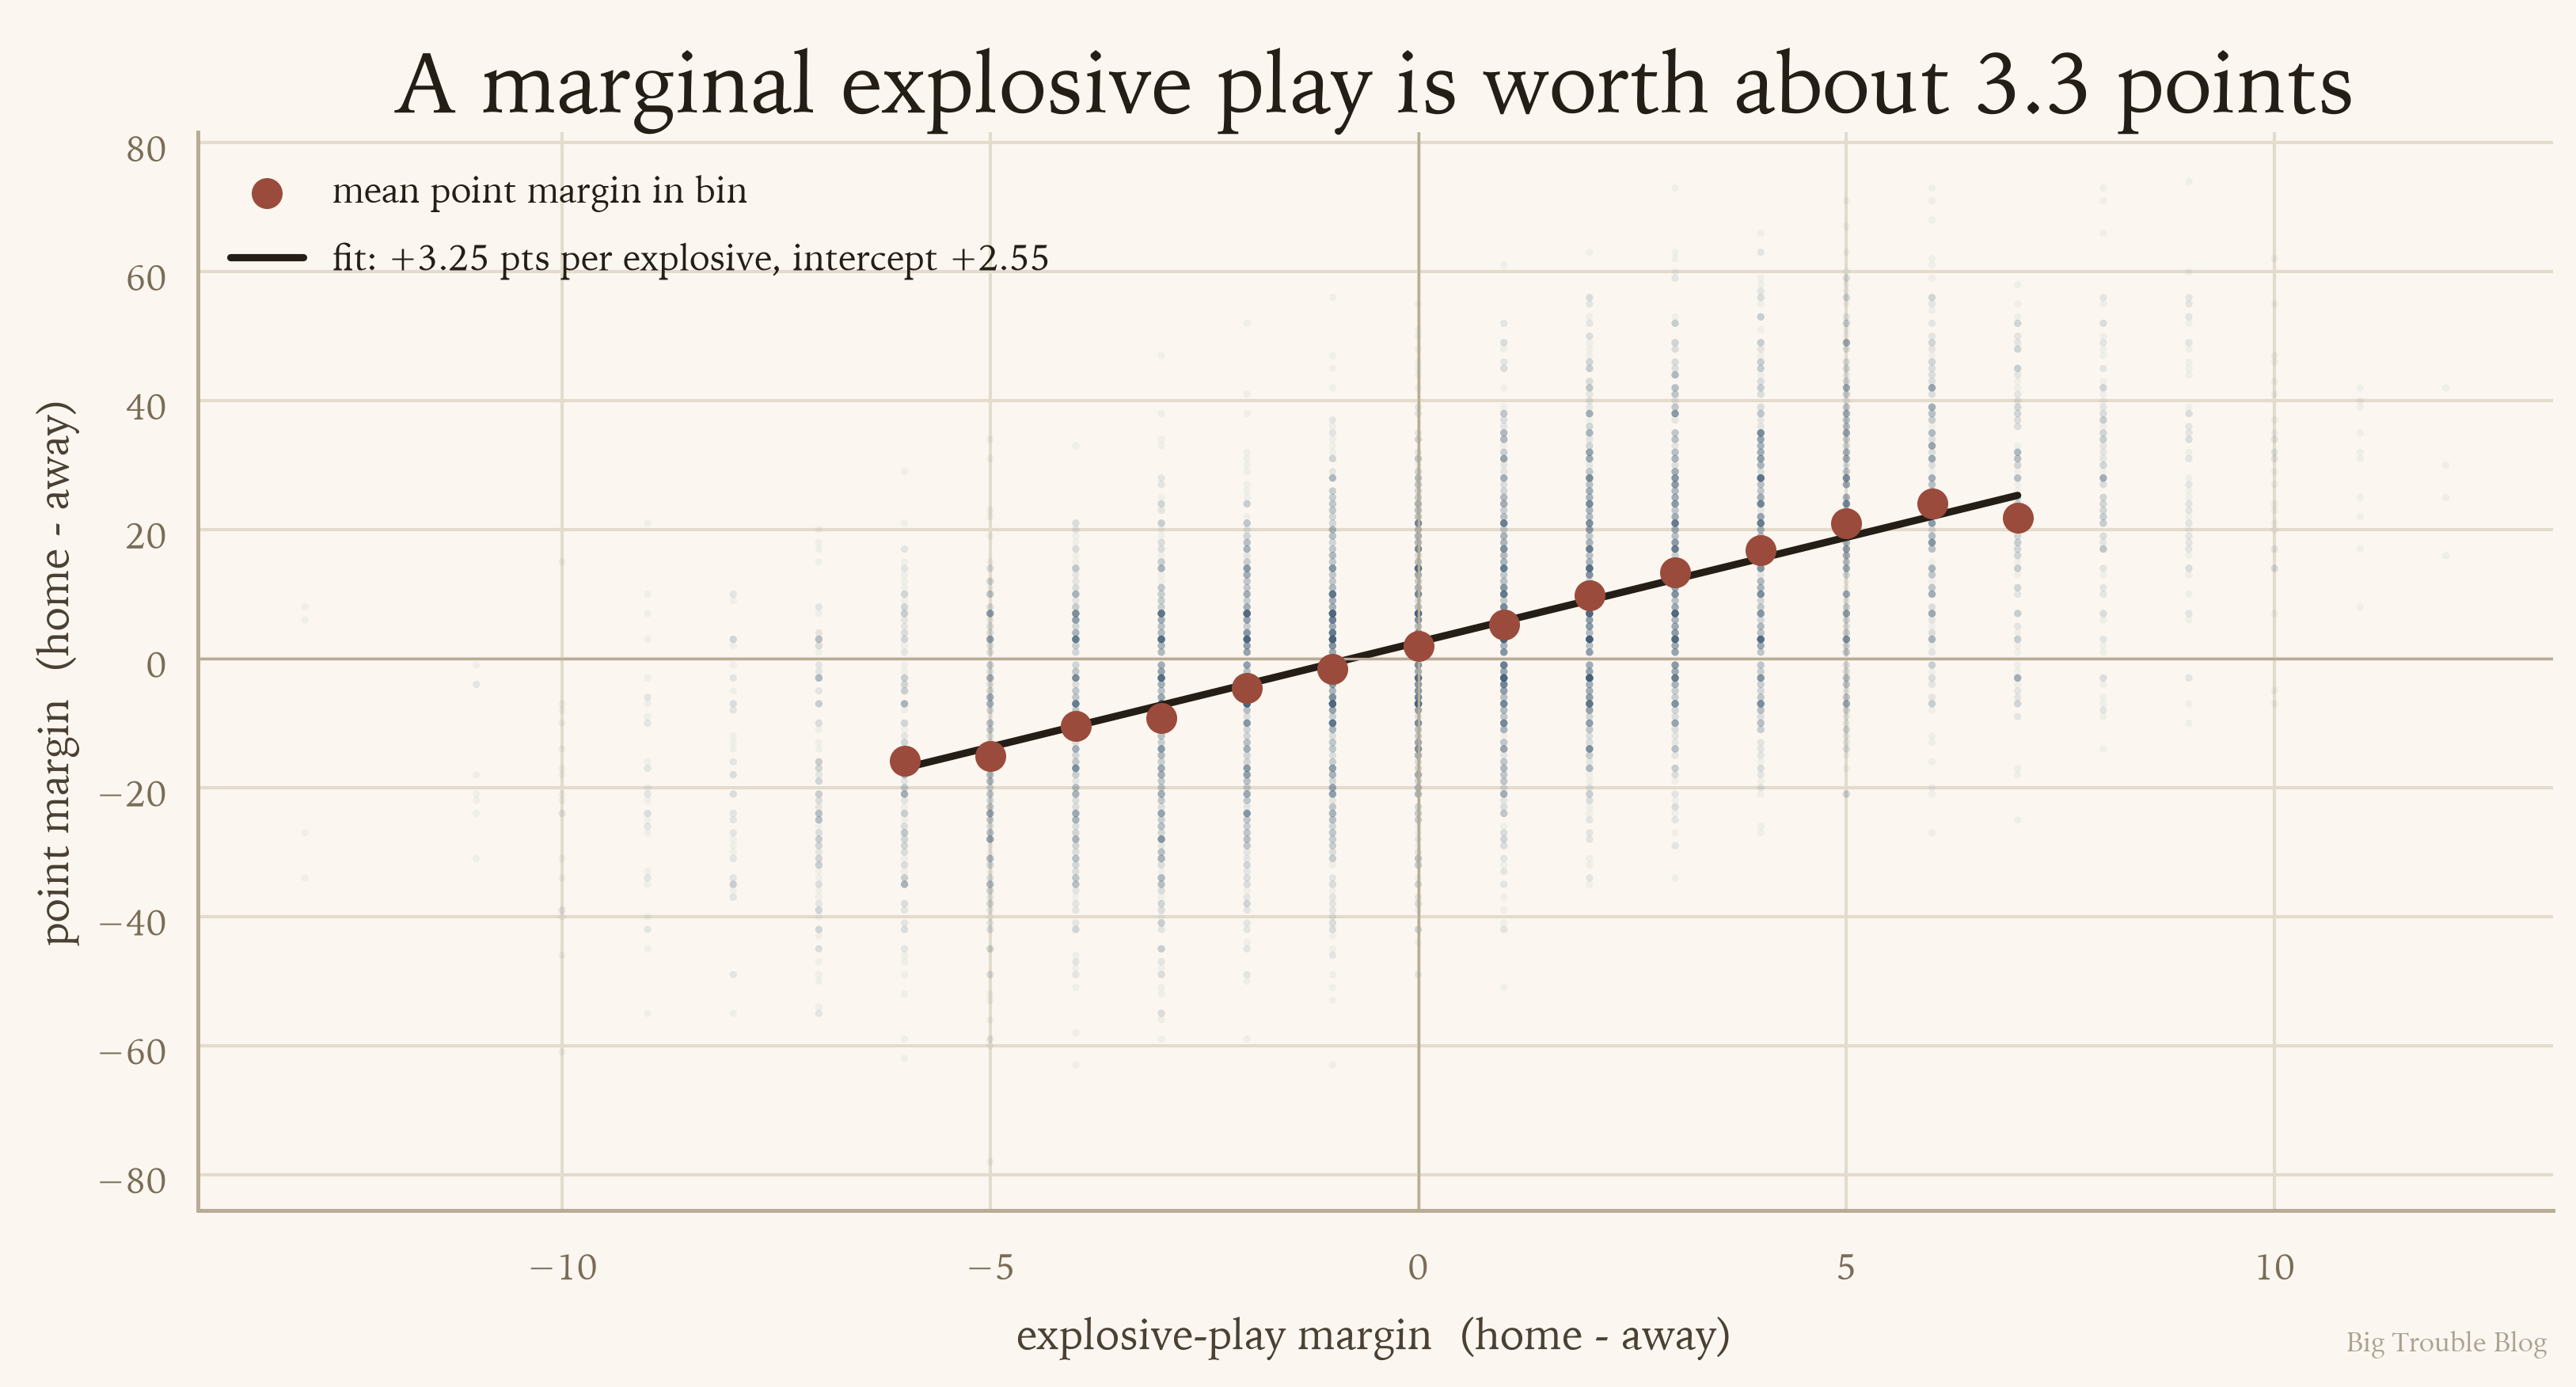
A consistent linear trend that even shows a slight home team point margin advantage at 0 explosive plays difference.
The y-intercept is +2.56 points at zero explosive margin — that is home-field advantage, landing right around the 3 point rule of thumb.
Why don't these numbers match?
One analysis says a drive with an explosive play is worth 3.46 more points. Another says an explosive play buys about 0.96. You may have reasoned this discrepancy out already but if not, its because a drive with an explosive play has 1.34 of them, not one. One value prices a kind of drive; the other prices a single play.
Re-pricing every snap on every drive through the field-position model splits the gap properly:
| Source of the +3.46 | points | share |
|---|---|---|
| field position bought by the explosive plays | +1.943 | 56% |
| field position bought by every other play | +0.457 | 13% |
| where the drive started | −0.114 | −3% |
| converting position into points | +1.170 | 34% |
6. Where does the value come from?
On the podcast, the explanation is that an explosive play "flips the field." That is testable, and the test needs two numbers: what the new field position is worth, and how often a drive would have gotten there anyway.
The way to get both is to model a drive as a chain of field-position states. Carve the field into 5-yard bands, and from each band a set of downs either earns a first down — moving to a new band — or ends the drive in one of seven ways: touchdown, field goal, punt, turnover, missed kick, defensive touchdown, safety. Run that forward and you can read off both the expected points from any starting spot and the probability a drive ever reaches a given yard line under its own power.
For example: a 20-yard gain moving an offense from its own 35 to the opponent's 45.
| own 35 | opp 45 | change | |
|---|---|---|---|
| expected points on the drive | 2.30 | 3.26 | +0.96 |
| chance of a touchdown | 30.6% | 42.3% | +11.7 pts |
| chance of a punt | 35.5% | 16.0% | −19.5 pts |
So the field-position value of that one explosive play is about a point, not the 3.3 points an average explosive play was worth. The number the claim was really about is this: a drive starting at its own 35 reaches the opponent's 45 under its own power only 54.2% of the time.
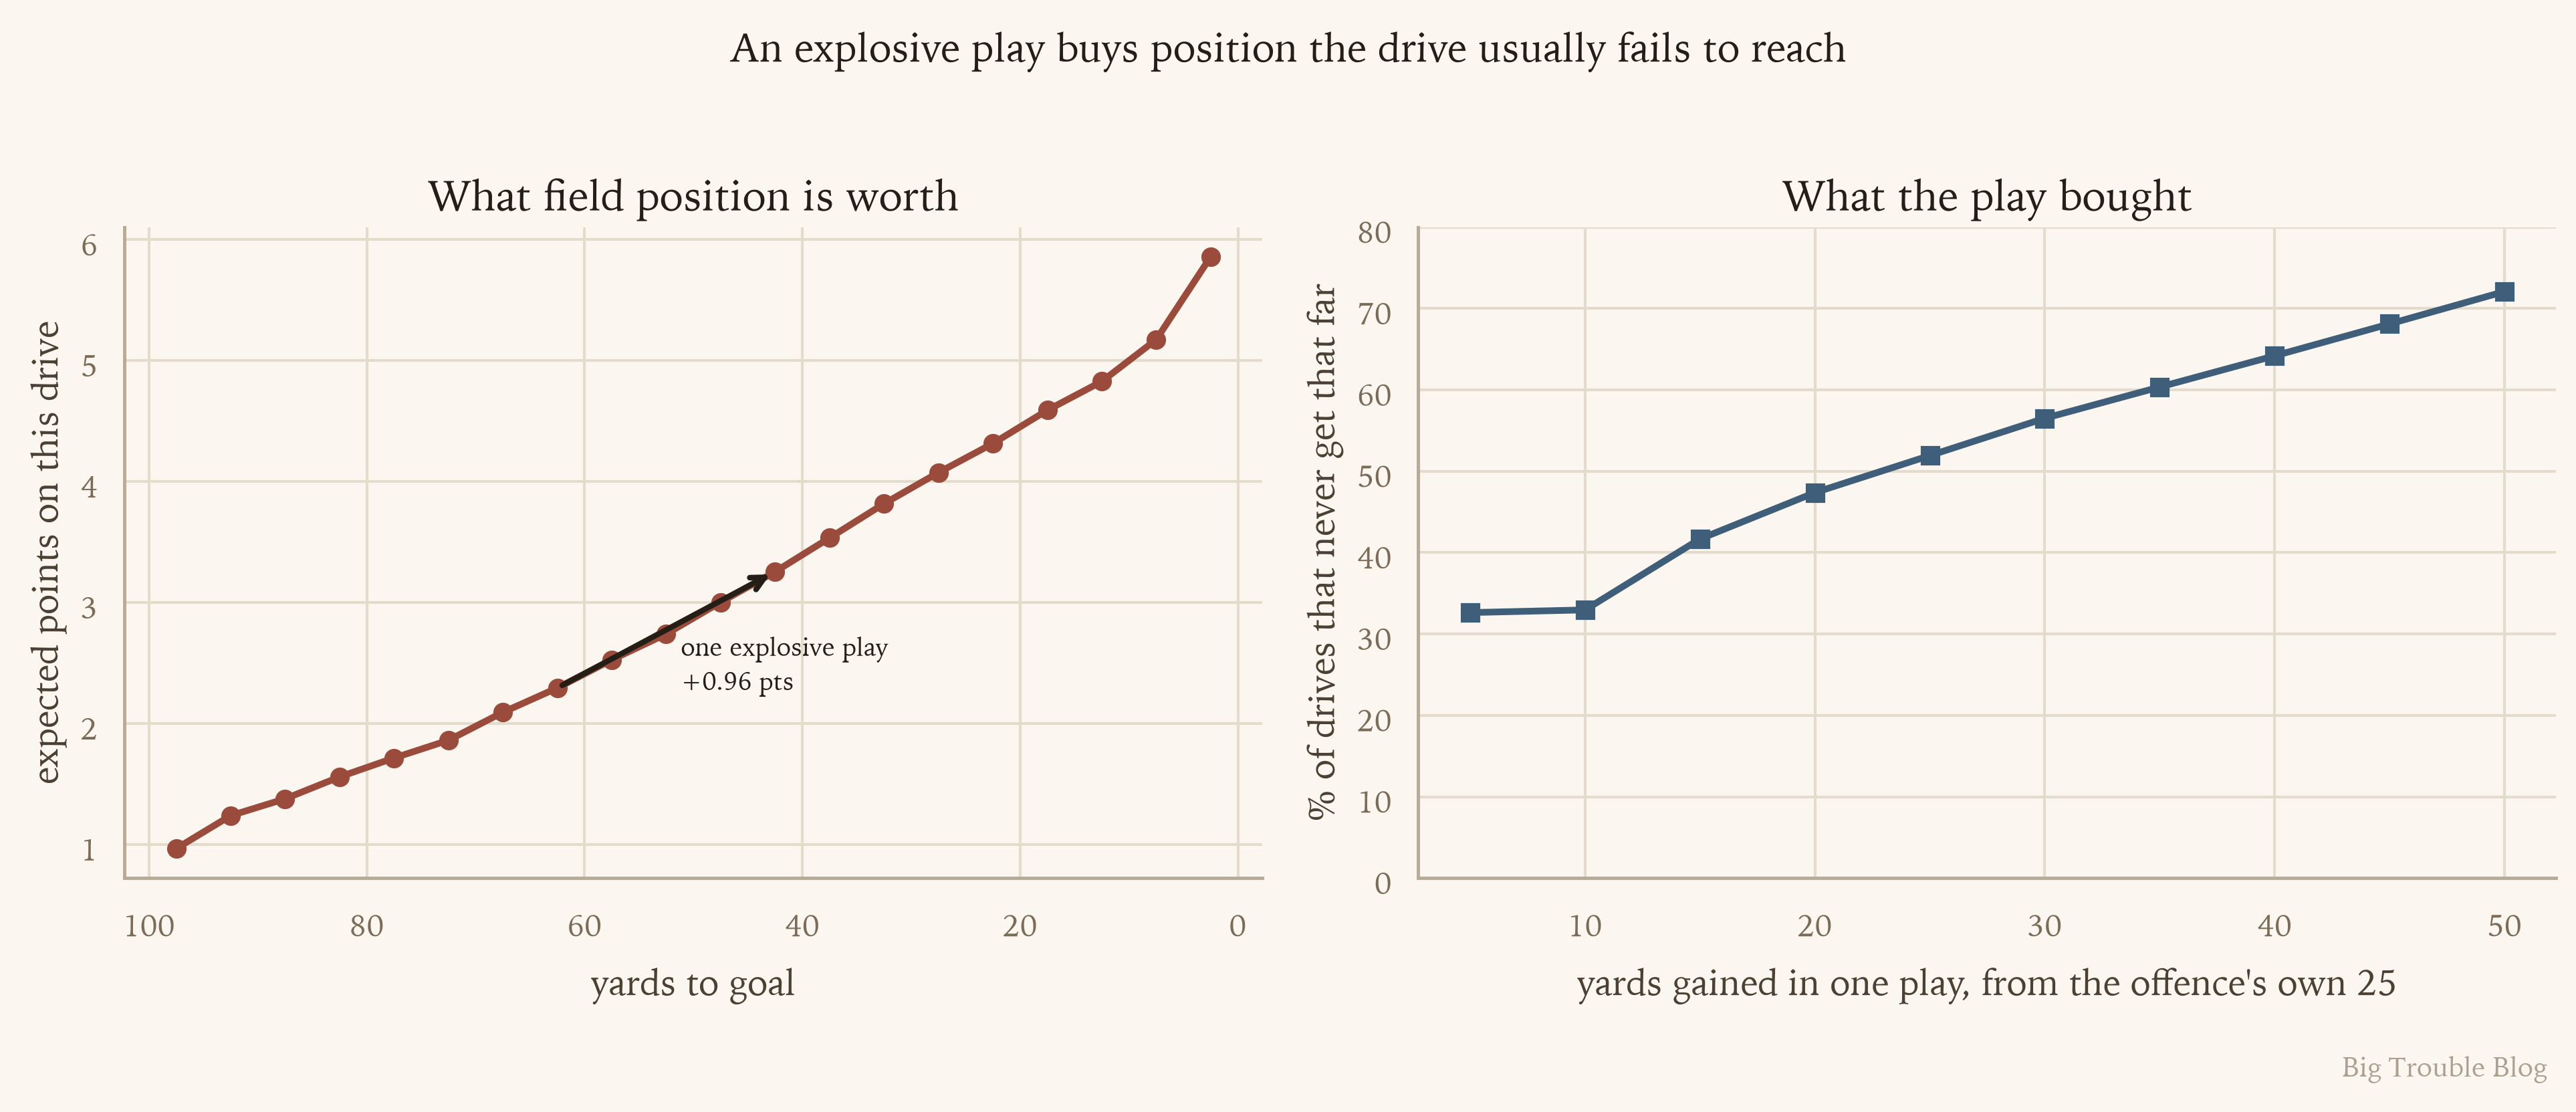
Points scale gently; rarity scales hard. From an offense's own 25, a 5-yard gain reaches a spot the drive gets to 67% of the time anyway. A 50-yard gain reaches one it makes only 28% of the time.
The effect is also remarkably flat across the field. A 20-yard gain is worth between +0.62 and +1.08 expected points from anywhere between the two 45s.
7. Has the value changed over time?
Common sentiment says that explosive football is in decline. Whether it is right depends on whether you are counting rates or totals.
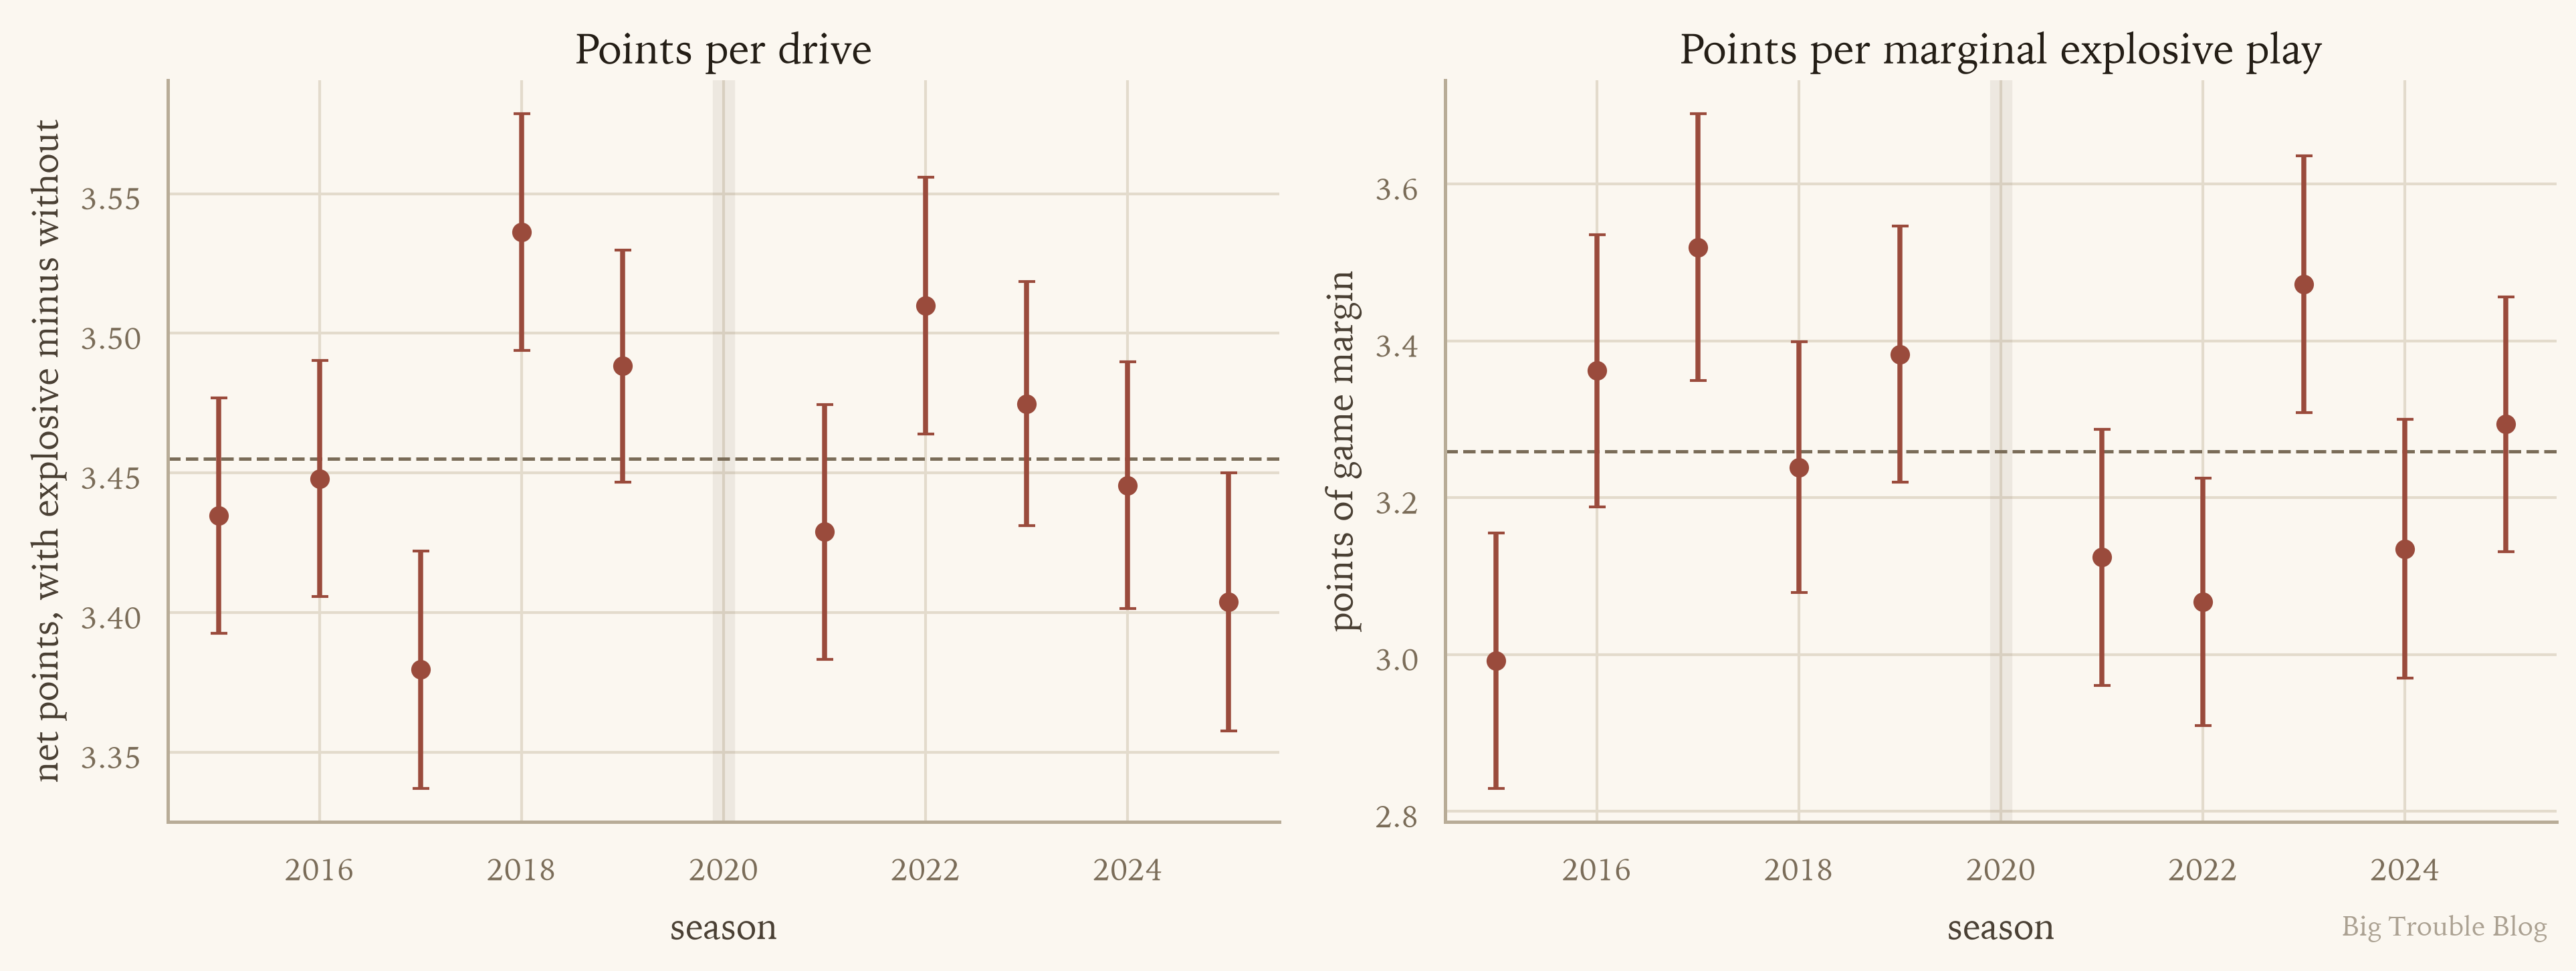
Left: Since 2018 we've seen a small but steady downward trend in points per drive. Right: While Points per explosive play has been less consistent, we've seen a recent uptick in value after a low in 2022.
Again on the podcast, the hosts discussed the general recent trend of fewer drives and plays per game (due to factors such as clock rule changes and general shift in offensive/defensive strategy meta), and that because of this, an explosive play should be worth more than it was a few seasons ago. In the table and plot below we can roughly confirm that. We see that plays per game have been going down consistently as well as the raw number of explosive plays.
| 2015–19 | 2021–25 | change | |
|---|---|---|---|
| explosive rate, % of plays | 10.48 | 10.25 | −2.2% |
| points-per-drive gap | 3.46 | 3.45 | −0.1% |
| plays per team-game | 61.73 | 59.19 | −4.1% |
| drives per game | 22.71 | 21.25 | −6.4% |
| explosive plays per team-game | 6.47 | 6.07 | −6.2% |
| explosive points per team-game | 21.00 | 19.70 | −6.2% |
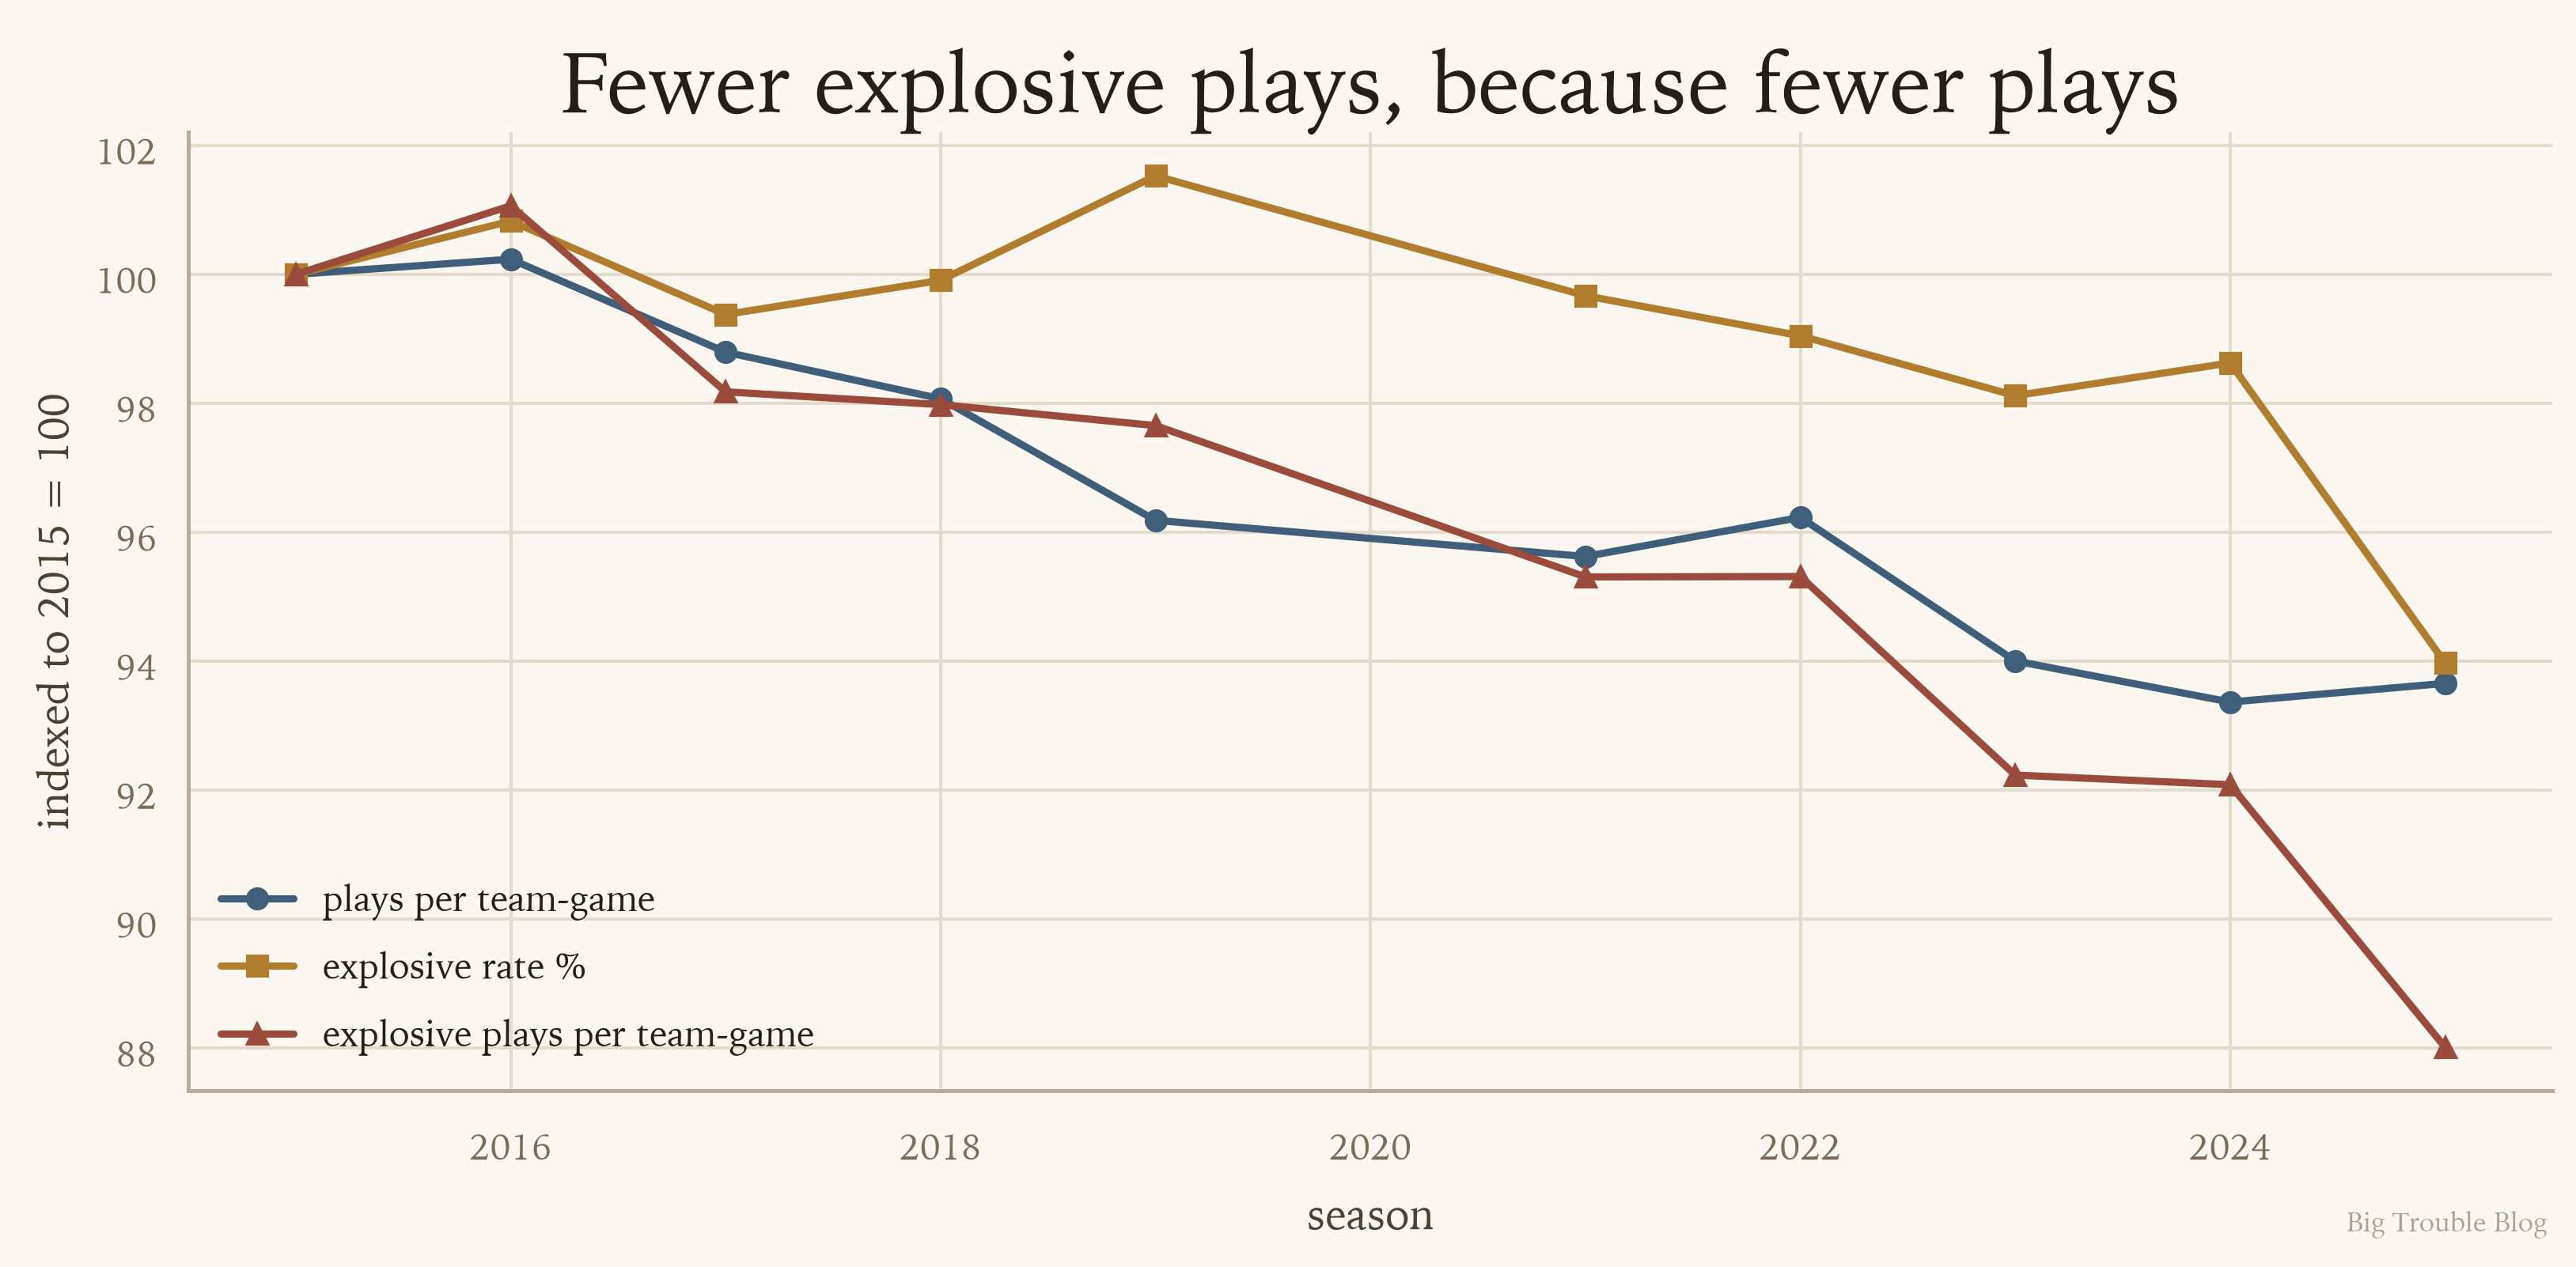
Fewer explosive plays, because fewer plays. Teams take about two and a half fewer snaps a game than in 2015.
Takeaways
As we've established, scoring drives are extremely important for the overall success of a team.
- A drive with an explosive play is over 5x more likely to result in a score.
- A significant part of the value of an explosive play is simply in the gain in field position itself, not just raw points themselves.
- Yards are yards in regards to explosive plays, coming from a rush or pass doesn't make much of a difference.
- The total number of explosive plays is going down, but that's because the total number of all plays is going down. The rate of explosive plays is about the same over this timeframe.
- As a result, the value of a marginal explosive play has been increasing in recent years, though we don't see this as a trend compared to longer-term data.
It seems like we can replicate the main claims from the podcast with our own data from CFBD. We might be off on specific values, this could be due to a number of reasons, such as: different garbage time definitions, inclusion of FBS/FCS games, or the change in definition of "explosive play" itself. However the overall trends seem to check out on an independent analysis.
Thanks to Steven Godfrey and Parker Fleming for the interesting discussion and CFBD for providing the data.