Which teams actually bring in the most viewers?
Its easy to take TV ratings at face value and assume that whoever has the biggest numbers much be the biggest draw, but there are numerous factors that go into TV ratings other than just which two teams are playing. Some obvious examples are: 1) What network is the game on? Network broadcasts are more accessible than ESPN/cable which is more accessible than streaming. 2) What time is the game at? Primetime is named that for a reason, whereas much of the country is asleep by the time Pac-12 after dark gets up to speed. 3) What are the rankings of the teams involved? While fans of the teams playing will be interested no matter their ranking (up to a point), for casual fans, having one or more ranked teams involved can be a signal to pay more attention to a game.
We can take those factors and a variety of others described more below to build a model that can say "given a game on network X, at time Y, etc. What would we expect the TV ratings to be?" Below are the results of a model fit to every college football telecast with a published audience from 2013 to 2025: 4,866 games, from Sports Media Watch's weekly ratings tables, each matched to the game it aired.
TL;DR:
- Alabama, Michigan, and Ohio State get 2.3× the audience of an average program once network, kickoff time, rankings and stakes are held equal.
- The same game on ABC gets a 60% viewership bump compared to the same game on ESPN. ESPNU gets about 20% the audience of ESPN.
- 0.79 is the correlation between a program's draw and how good it has been. The rest is brand.
- About 4% of the audience is lost to a two-touchdown blowout. The matchup sets the audience before kickoff, and the game itself barely moves it.
1. Separating the game from the matchup
Raw audiences mostly measure the slot. The median measured game drew 1.3 million viewers. The 2014 national championship drew 34 million. A Saturday-night ABC game and a Thursday ESPNU game differ by more than any two teams do, and the best teams get the best slots, so a raw average flatters them twice.
The model takes that apart. Each telecast's audience, on a log scale, is the sum of:
- the draw of each of the two teams, which we'll get to below;
- the network and the kickoff window;
- each team's ranking in the poll that was current that week;
- the stakes: regular season, bowl, New Year's Six bowl, or playoff;
- the matchup: conference game, neutral site, or an FCS opponent;
- broadcast competition, counted as the number of other measured games airing at the same time;
- a season term, which absorbs year-to-year changes in how audiences are counted.
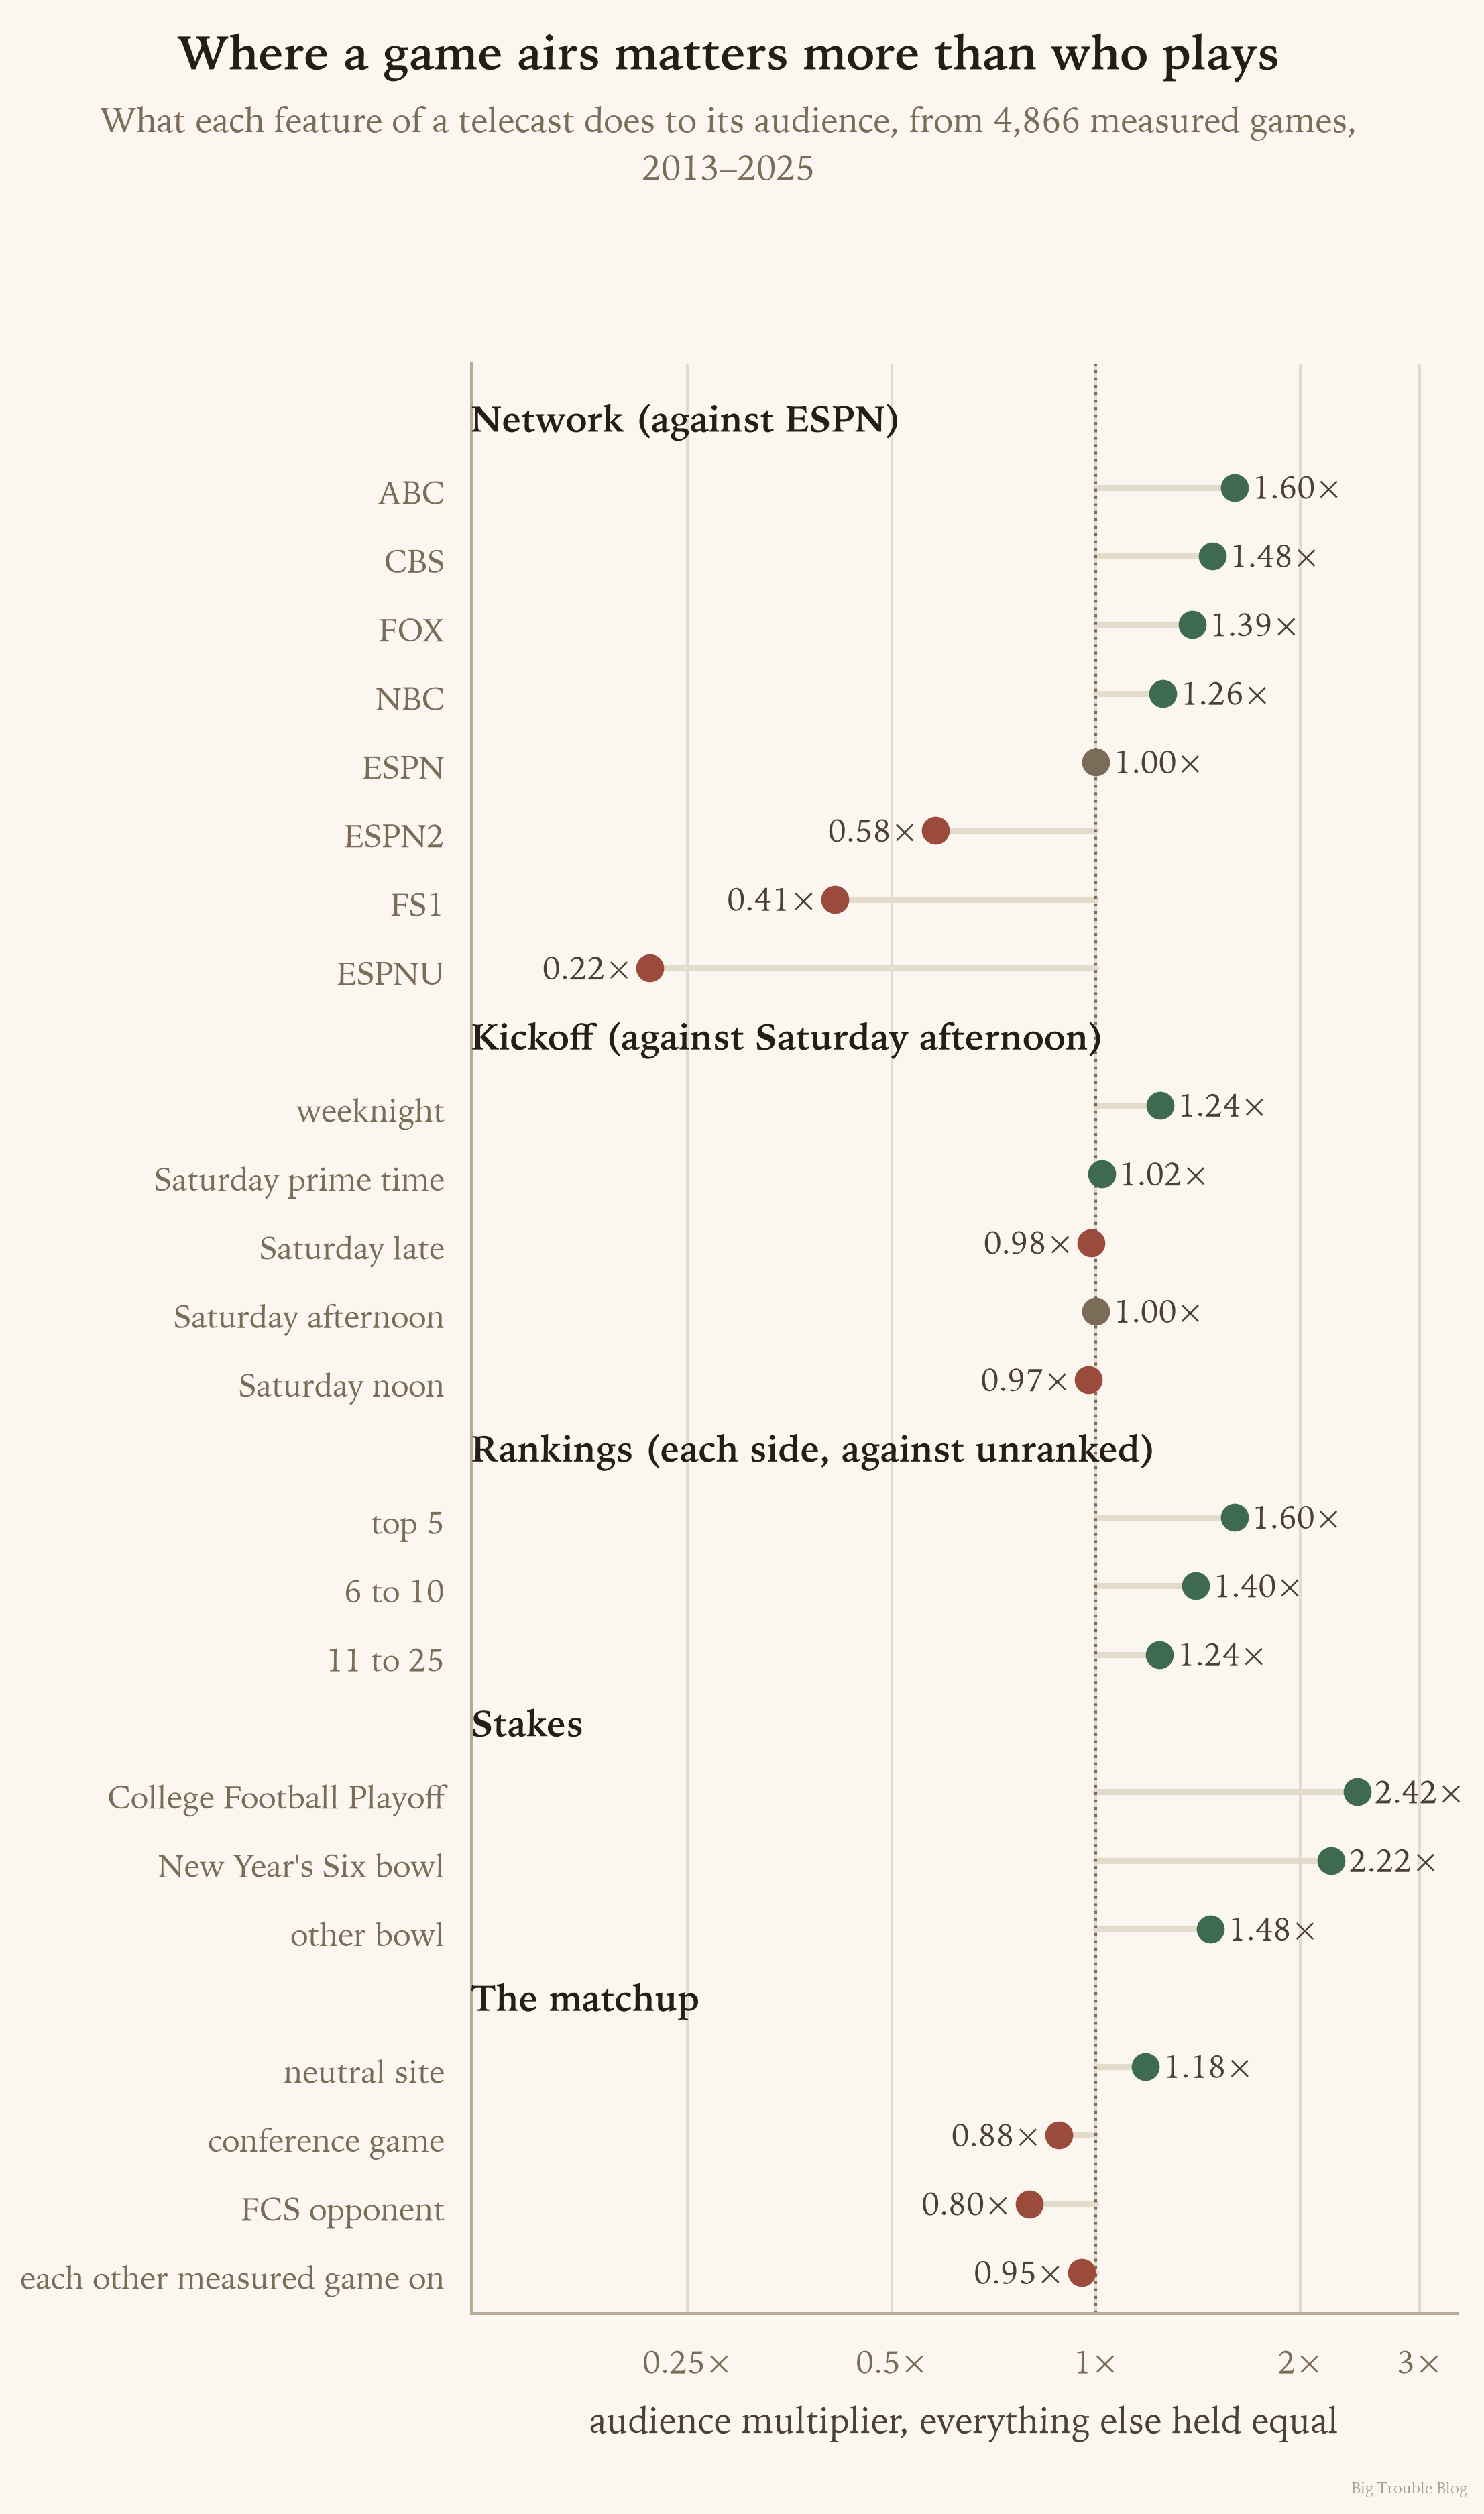
Each dot is what one feature of a telecast does to its audience with everything else held equal. The model is fit on all 4,583 telecasts from 2013 to 2025 except 2020.
Most of the findings match up with what we would expect - broadcast networks get the most viewers, the higher rated the teams are the better, etc. Notably though, kickoff time matters less than its reputation once the network is accounted for: Saturday prime time is worth only about 2% over the afternoon, because the prime-time premium mostly reflects which network gets the window. Weeknight games do better, at 24%, even after their lack of competing games is accounted for. Clearly America yearns for more MACtion.
2. Try it: predict a game's audience
Let's start with a real example: Iowa at Iowa State on September 6, 2025, a noon kickoff on FOX with Iowa State ranked. The model says about 2.8 million. The game drew 4.3 million, a miss of about 1.5×, close to the model's typical miss. Nothing in the model knows that this was the Cy-Hawk rivalry, with Iowa State coming off an 11-win season.
The audience calculator needs JavaScript.
3. Who really brings the audience?
Now that we've found out what everything else is worth, we can use that to calculate which teams over or underperform what audience an average team would draw. At the top of the list are teams most people would guess. Alabama, Michigan, and Ohio State are effectively tied at 2.3× an average program. Nebraska is fourth, at 2.18×, ahead of Texas, Georgia, and LSU, over a period in which it never won more than nine games in a season. Notre Dame, with more measured telecasts than any other program (143), is 17th at 1.7×. Clemson is 22nd at 1.55×, behind Iowa, Arkansas, and South Carolina.
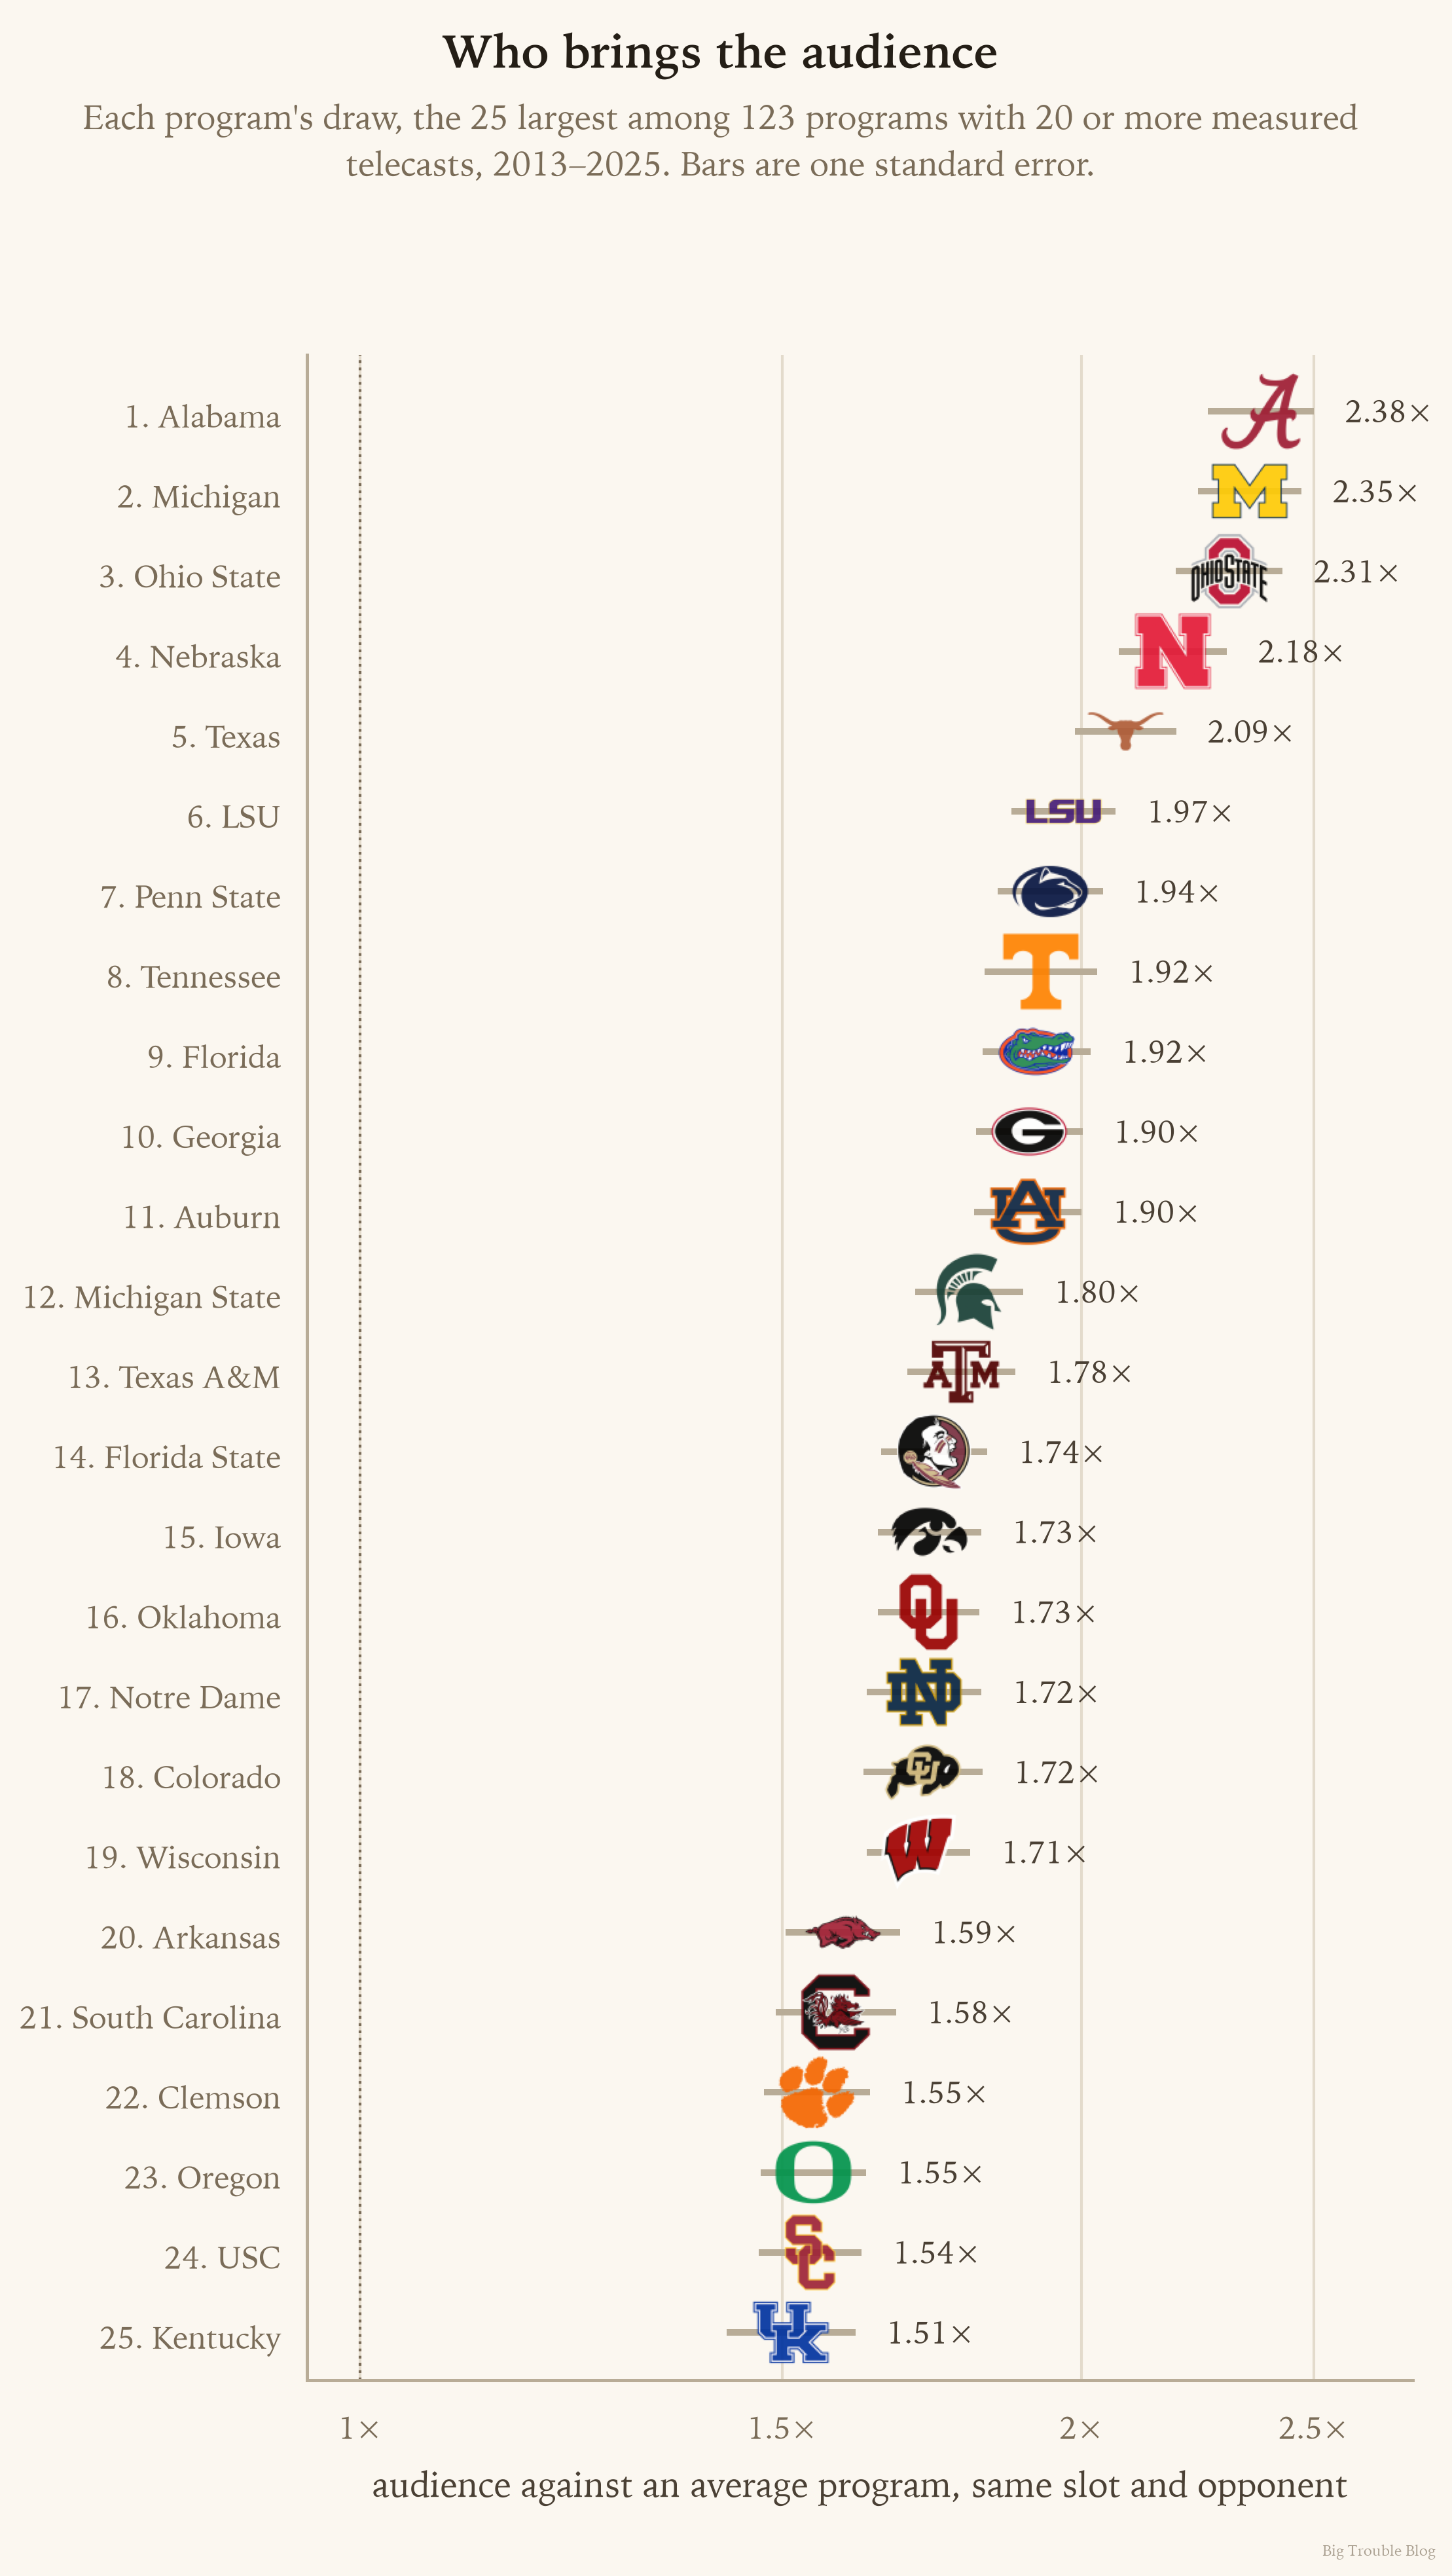
Each program's draw: the audience it brings against an average program, in the same slot against the same opponent. Programs with fewer than 20 measured telecasts are left off the chart, since their estimates are too uncertain to rank.
4. Turns out, being good is more entertaining
Blue bloods obviously draw the biggest viewership numbers, but how much of that is due to being good independent of being a big name?
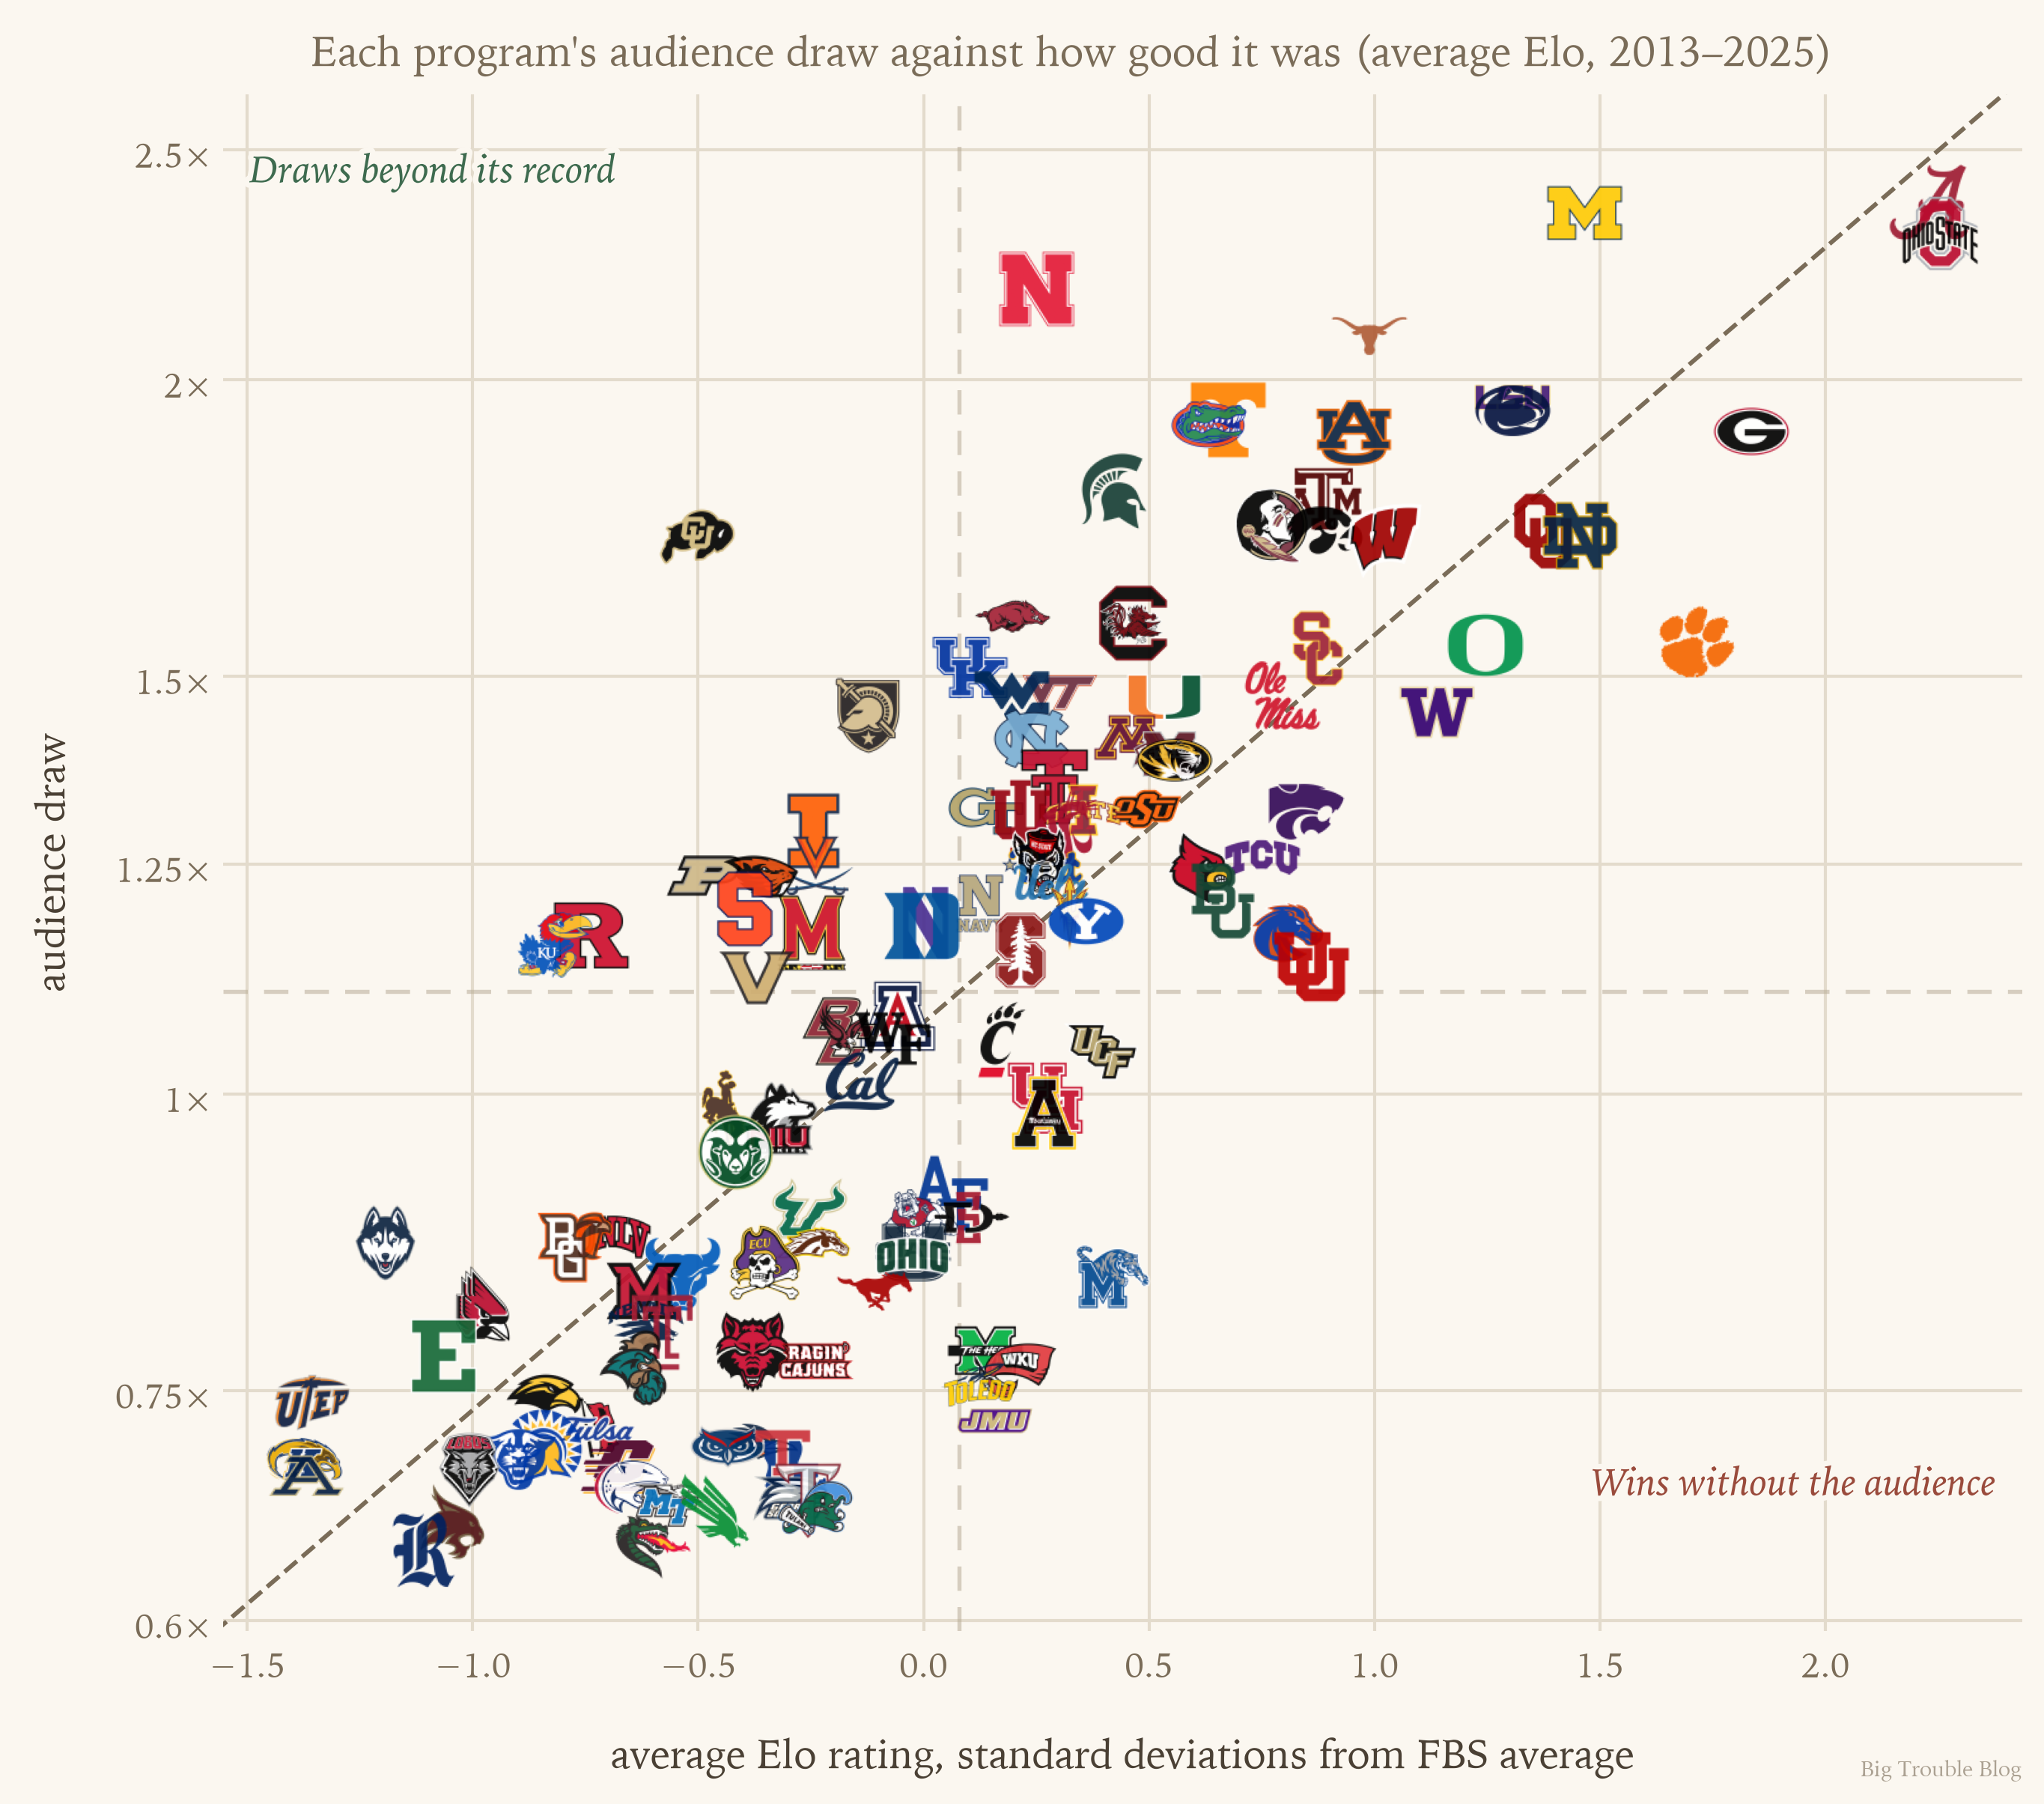
Each program's audience draw against its average Elo rating, 2013–2025, for the 123 programs measured 20 or more times.
5. Which teams are building (or losing) an audience?
Brands change slowly, but they still change. Fitting the same model separately on 2015–2019 and on 2021–2025 gives each program two draws.
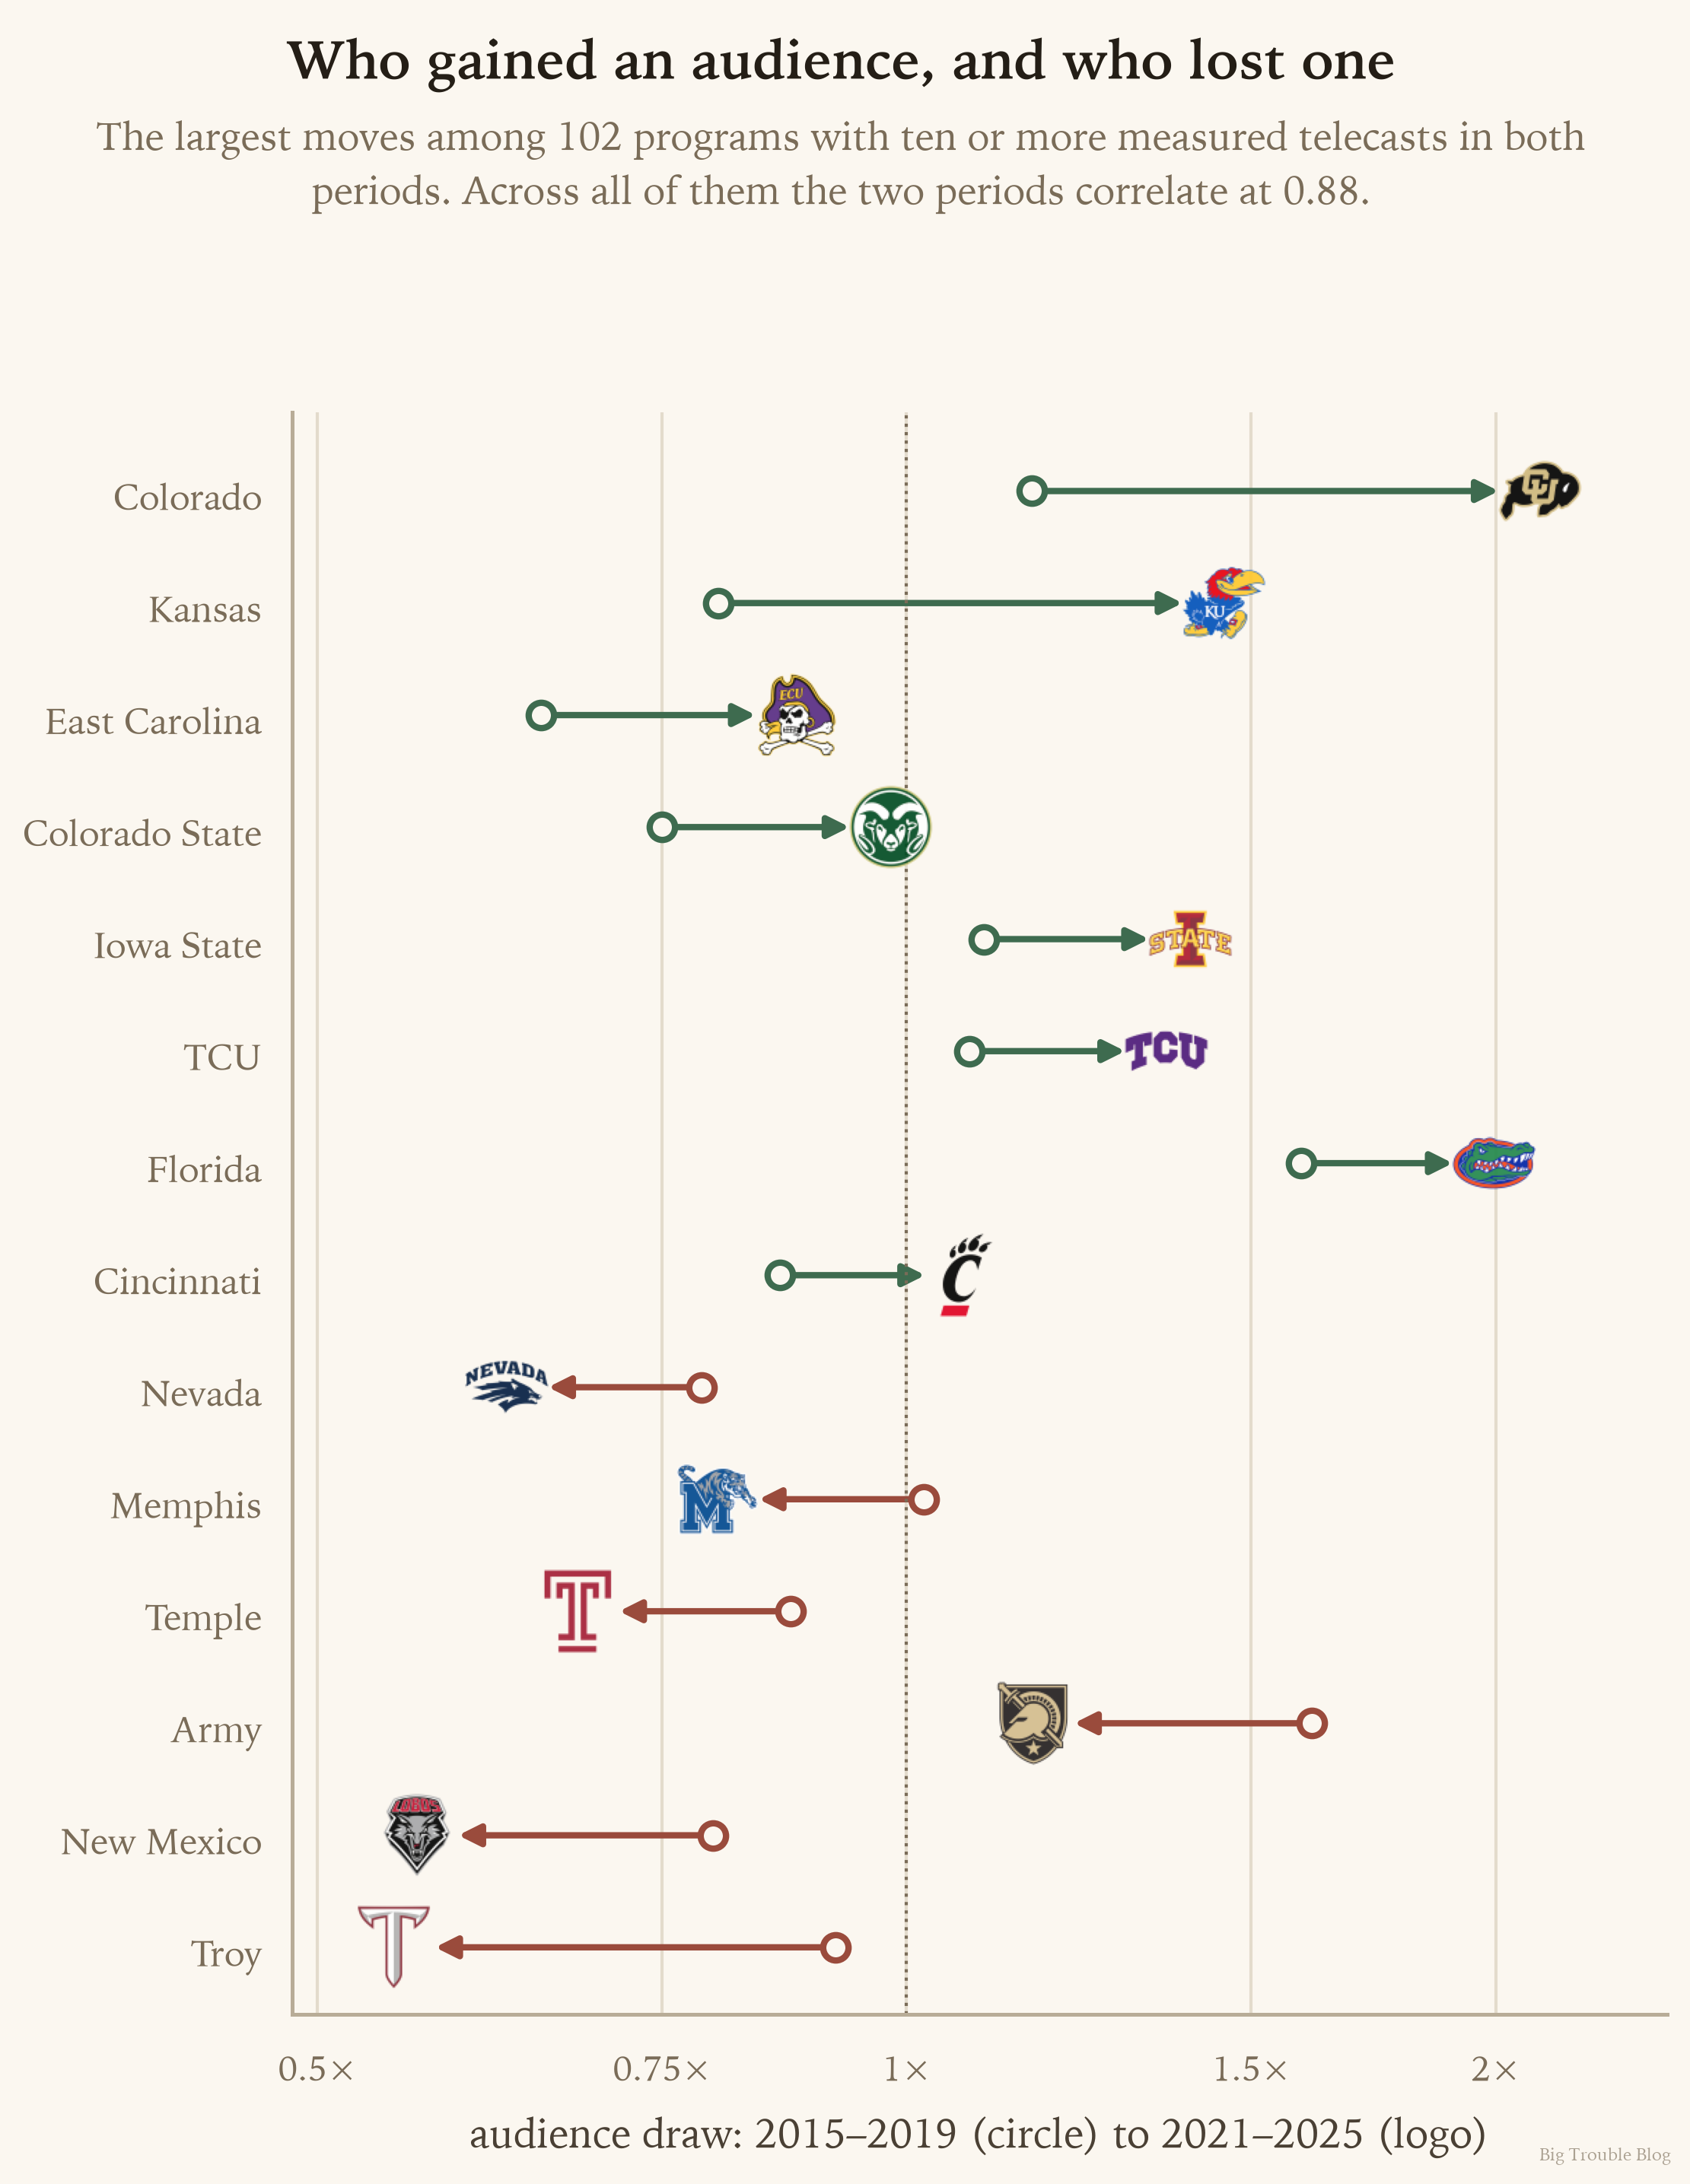
Most programs barely move: across all 102 schools with enough measured games in both time periods, their two values correlate at 0.88. Some notable movers include:
- Colorado went from 1.16× to 2.11×, the largest rise of any program and fourth in the country in 2021–2025. That is Deion Sanders.
- Kansas went from 0.80× to 1.45×, almost as large a rise, on the back of a 2022 bowl team and a nine-win 2023.
- Iowa State went from 1.10× to 1.40×, 32nd in the recent period.
- BYU went from 1.01× to 1.24× as it moved into the Big 12.
- Army fell from 1.61× to 1.16×. Its 2015–2019 draw rested on 15 telecasts, five of them Army–Navy and four against Notre Dame, Ohio State, Michigan, and Penn State.
- Memphis fell from 1.02× to 0.80×. Troy, New Mexico, Temple, and Nevada fell as far or further.
6. Does a close game matter?
Only a little. The audience figure is the average over the whole broadcast, so we would expect that a blowout should lose its second half. Adding the game's final margin and how it unfolded to the model:
- a two-touchdown final margin costs about 4% of the audience against a one-score game;
- a game decided by halftime costs about 4% against one decided at the end;
- a game that stays within one score through the second half gains about 8%.
Those are real and in the expected direction, and they are small next to anything in section 1. By the time the game starts, its audience is mostly set by who is playing, where it airs, and what is at stake.
Some important notes
- It is a model of the games that were measured. Most streaming-only and conference-network games have no published audience, so a program's draw comes from its biggest games. That flatters programs that are rarely on national television and land a big window when they are.
- Audience counts changed over the period. Nielsen expanded out-of-home viewing in 2020 and moved to a big-data panel in 2025. The season term absorbs a uniform shift but not one that affected some networks more than others.
Data: Sports Media Watch weekly college football TV ratings, 2013–2025; CollegeFootballData schedules, rankings, scores and Elo ratings. The model is a penalised fixed-effects regression of log viewers on both teams' draws plus network, kickoff window, rankings, stakes, matchup, and competing telecasts, with season effects.